About this lesson
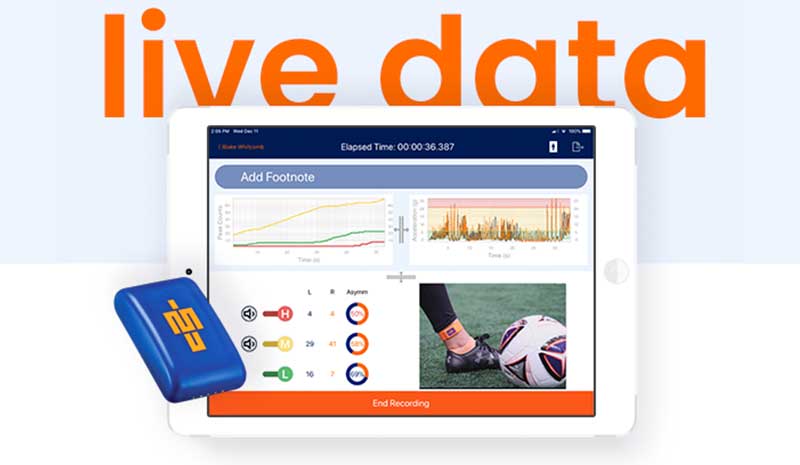
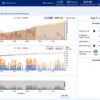
The IMU-Step Dashboard displays your processed data in a series of 4 graphs. Each graph focuses on different aspects of the subject’s lower limb profile. After this lesson, you will be comfortable navigating the dashboard and customizing each graph to your needs.
What You'll Learn
In this video lesson you will learn:
- The overall structure and outputs of each graph
- How to navigate between different athletes and graphics
- The unique features of each graph
- Where to find more information


Resources and Further Reading
What is Impact Load? – A quick guide to IMU’s load monitoring metric
What is Bone Stimulus? – An intro article on our patented bone stimulus metric