Cricket New South Wales’ (Cricket NSW) Sport Science & Sport Medicine (SSSM) team is responsible for the physical preparation of some of the biggest names in Australian cricket. Keeping Australia’s fast bowlers fit is one of their main priorities. Especially given the high-intensity actions that these athletes are exposing themselves to each and every day.
Lumbar stress fractures and other lower back injuries are commonplace in fast bowlers. These injuries often keep these prized assets on the sidelines for weeks or months at a time. This winter, the SSSM team at Cricket NSW made it a priority to try to understand more about the loads that these athletes are exposed to. It was particularly important to use data to compare across different environmental and training conditions. This case study will walk you through the process of how Cricket NSW, with the help of IMU Step, structured and executed their investigation.
Step 1. Asking the right questions
“We had a number of questions around our fast bowlers. Our main question was, how does indoor bowling compare to outdoor bowling? When bowling outdoors, which is mainly in the summer, we can use GPS to try and quantify some of the physical demands. However, during the winter pre-season or periods of bad weather when we are confined to indoor environments, it’s a bit more challenging to measure loading,” Tom Reddin, Head of SSSM at Cricket NSW, explained.
“Anecdotally players feel that bowling indoors is harder on their body. There’s a feeling that it may potentially contribute to some injuries and even lumbar spine injuries,” Tom continued. “Lumbar spine injuries are probably the unsolved problem of cricket so we were hoping that IMU Step could provide some further insights that might help guide our management of pace bowlers going forward.
Secondly, we had a series of questions that we wanted to answer around bowling run-up/intensity. For example, we were interested in the loading variances at different bowling run-up lengths – three-step run-up, quarter length, half-length, three-quarter length, and full-length run-ups are typical increments. Additionally, bowlers tend to alter loading through the intensity of effort, so we wanted to see loading variances at different intensity levels such as 70%, 80%, 90% etc.
Then the third part of it was the differences between bowlers. Some bowlers have a very ‘heavy’ bowling action whereas some have a ‘light’ bowling action where they just seem to skip through the crease. Was there a tangible difference in the impact loading on lower limbs with different bowling styles?”
For this investigation, Tom whittled his questions down to 3 that he felt would most inform his practice:
- How does bowling load differ between indoor and outdoor bouts?
- How do changes in bowling run-up lengths & intensities affect overall loads?
- Do bowling style differences lead to a tangible difference in load?
2. Collecting the Right Data
Cricket NSW identified IMeasureU’s IMU-Step solution as the product of choice because they were interested in tracking impacts at the lower limbs. IMeasureU also offers sports science consulting and assisted in formulating a framework to answer these key questions. IMU Applied Consultant, Andrew Gray took the lead and arranged the study.
“The IMU Step product was a really practical bit of technology that could be applied directly to the limb that was having the ground contact as opposed to traditional GPS systems which sit between the scapula,” Tom explains. “It was great to have Andrew’s experience and expertise in this area which has helped us immensely.”
“I got an understanding of Cricket NSW’s questions and what they were trying to achieve. I then quickly set out to understand how I could assist,” Andrew said. He helped CNSW define what variables they wanted to track and then developed a system to help tag the sessions using the IMU-Step footnote feature.
“My first aim was to create a process to ‘footnote’ the data” Andrew continued, “All that means is that we split and timestamped the data. In team sports that might be a warm-up and a small-sided game. Or it could be some speed work or some conditioning work. In cricket, that can either be a session, it can be an over, or it can be right down to delivery. Footnotes are what gives context to that segment of time and give us the ability to conduct comparative analysis.”
Tom and Andrew decided on six variables that they wanted to tag and investigate:
- Playing surface
- Venue name
- Run up speed
- Number of deliveries
- Avg bowling speed
- Bowling Intensity
Andrew helped the SSSM team create a footnote structure for bowling drills that incorporated this data into easy to manage tags that they could apply for each bowling session. The footnote structure he came up with was: Run-up speed_bowling intensity_surface_venue. So if the SSSM team asked Mitch Starc do a bowling session with a half speed run up, at 70% intensity outdoors at the Drummoyne facility, they could easily note that as half_70_outdoor_drummoyne. The number of deliveries and average bowling speed was noted after the session.
Although Andrew was not onsite collecting data alongside Tom and the SSSM team, he was analyzing data remotely, creating reports that could be fed back to coaches and physios to begin to influence decision making with the bowlers involved.
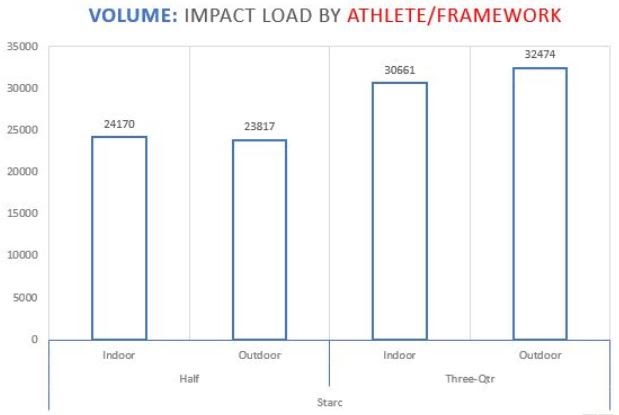
Figure 1: Volume – Impact load by athlete/framework
3. Creating the Framework for Analysis
Because the level of detail in each session was so high, Andrew was able to create multiple reports that investigated key aspects of each session and athlete. Over the course of the study, Andrew helped provide the SSSM team with 7 different reports to examine his athletes. The full report can be downloaded at the bottom of the page. Andrew explains some graphs that were of special significance.
“Tom and I collaborated on interrogating the data to see what we could find,” Andrew explained. “We’ve got four different graphs here; in figure 1 we’re looking at volume, so the metric we’re using there is impact load. In figure 2 we’re looking at density or impact load per minute. Here we can see whether not only the volume, but if the impact load per minute (the density of the session) changes from an indoor to an outdoor surface.”
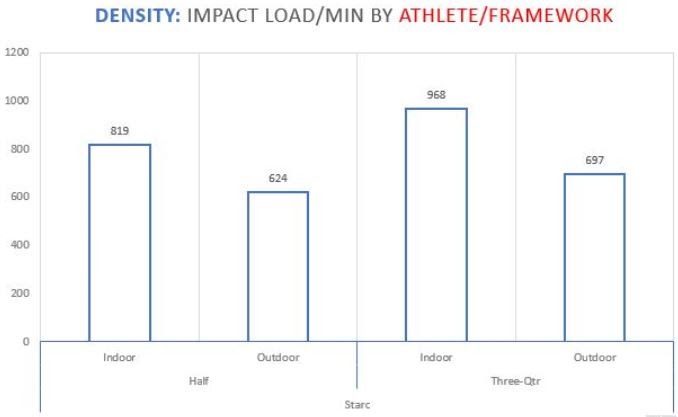
Figure 2: Density – Impact load/min by athlete/framework
“Because we had an understanding of how many deliveries were actually involved within a session, we can derive an impact load per delivery. The reason that’s really important is that it gives the Cricket NSW SSSM team the opportunity to prescribe load more objectively. If a coach plans a session using these parameters, the SSSM team is going to have the ability to understand the likely impact load of that session. They can then be proactive. make some recommendations about whether that is appropriate for his bowler’s level of physical preparation.”
Every step of a session is collected using the IMU Step sensors. Figure 3 is detailing the average left versus the average right step peak in g’s. This gives us an understanding of the difference between side to side impact load.
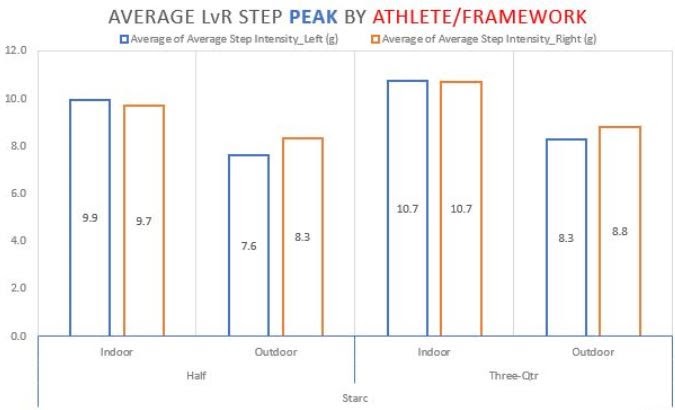
Figure 3: Average LvR step peak by athlete/framework
4. Making decisions with data
“You can see in figure 2 that we’ve got a higher density of impact load generated in an indoor versus outdoor session. This is the case at both run-up lengths,” Andrew explains. “We looked at it closer and saw that in an indoor session, typically the bowler will take less time between balls. This also affects the density. That instantly gave us actionable insights. Increasing the spacing of bowling indoors would mean that we are matching outdoor bowling more accurately.
Figure 3 is looking at the same bowler off the same run-up length, indoor versus outdoor. There is somewhere in the order of magnitude of around 25 to 30% difference in the average step peak from indoor to outdoor at the same intensity. That was a huge insight for us.”
The insights provided by Andrew via the IMU step system has already started to influence Cricket NSW SSSM practice.
“Although it confirms what anecdotally and subjectively we believed, which was bowling indoors does have a higher impact load than bowling outdoors, the magnitude of the difference was a real surprise,” explains Tom. “Since analyzing this data we have taken more care when planning indoor bowling. In season, if we get washed out and we’re forced to go from outdoors to indoors for a bowling session, we need to factor this data into the intensity that we prescribe for the bowlers to try to mitigate that risk of injury.
The individual differences were also a great insight for us. Bowlers like Pat Cummins and Mitch Starc aren’t with us very often, but when they are we are now aware of how we need to individualize their program. Again, it confirmed our belief about the ‘heavy’ and ‘light’ bowlers. We will now look at someone like Pat Cummins and at times be more mindful of the intensity of his bowling indoors because his impact loading is significantly higher (Figure 4). That’s on top of the fact that we know indoor bowling is already more impactful than outdoor bowling.
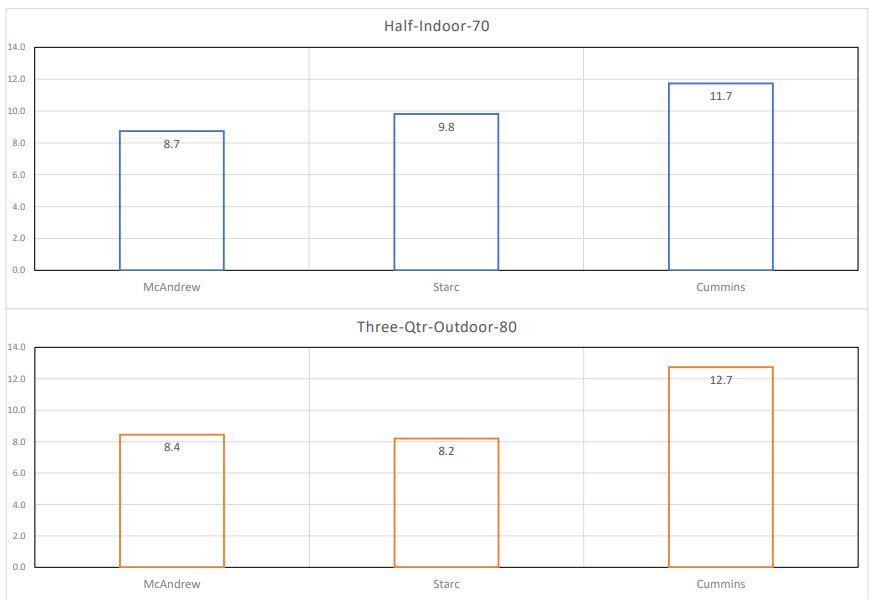
Figure 4: Bowler differences across different surfaces and run up lengths
5. Conclusions
So what answers did Tom find after asking his 3 questions?
Question 1: How does bowling load differ between indoor and outdoor bouts?
Finding: Average peak step intensity was ~27% higher in indoor sessions.
Question 2: How do changes in bowling run-up lengths / intensities affect overall loads?
Finding: There is a 26% increase in load per delivery with an 10% increase in prescribed bowling intensity (from 70% to 80%) regardless of bowling surface.
Question 3: Do bowling style differences lead to a tangible difference in load?
Finding: Pat Cummins had a much higher load per bowl (11.7 indoor, 12.7 outdoor) than Starc and McAndrew (~9.3 indoor, 8.3 outdoor)
Having a clear and concise question is key when collecting data with any technology. The SSSM team at Cricket NSW had exactly that. However, the question is just the first step. You must have the tools and the plan to analyze and segment the data. This helps bring the data to life. It gives it meaning and allows you to make confident decisions to improve the health and performance of your team. Tom and Andrew followed the points on this schematic –
Identify problem > create robust, concise question > identify valid and reliable technology > collect data > segment and visualize data simply > draw conclusions > inform practice
To learn more about how IMeasureU can help you answer your questions and speak with a sports scientist in your region, get in touch with us here.
Download the report
Click this link to download Tom’s report and see the full dataset for yourself.
Learn more
This case study builds on concepts we’ve explored in-depth at IMeasureU. Follow the links below to learn more –
How to Monitor your Athletes Remotely
Understanding External Biomechanical Load During ACLR Rehabilitation – A webinar with Mark Armitage
Managing the Mental Side of Injury During Quarantine
Have an injured athlete? Get in touch with us and ask about a free demo of IMU Step to see how we can help your return to play.