The Wests Tigers in National Rugby League (NRL) and their High-Performance Manager, Andrew Gray, are at the forefront of using inertial sensors to keep their athletes healthy. As many as one in four players are injured
at any one time in senior, professional rugby league; so creating a system that is streamlined and fully integrated is essential to enable performance staff to successfully return their athletes to full training and competition. Andrew Gray has been building these systems for years and agreed to walk us through his foundational methods for this setup.
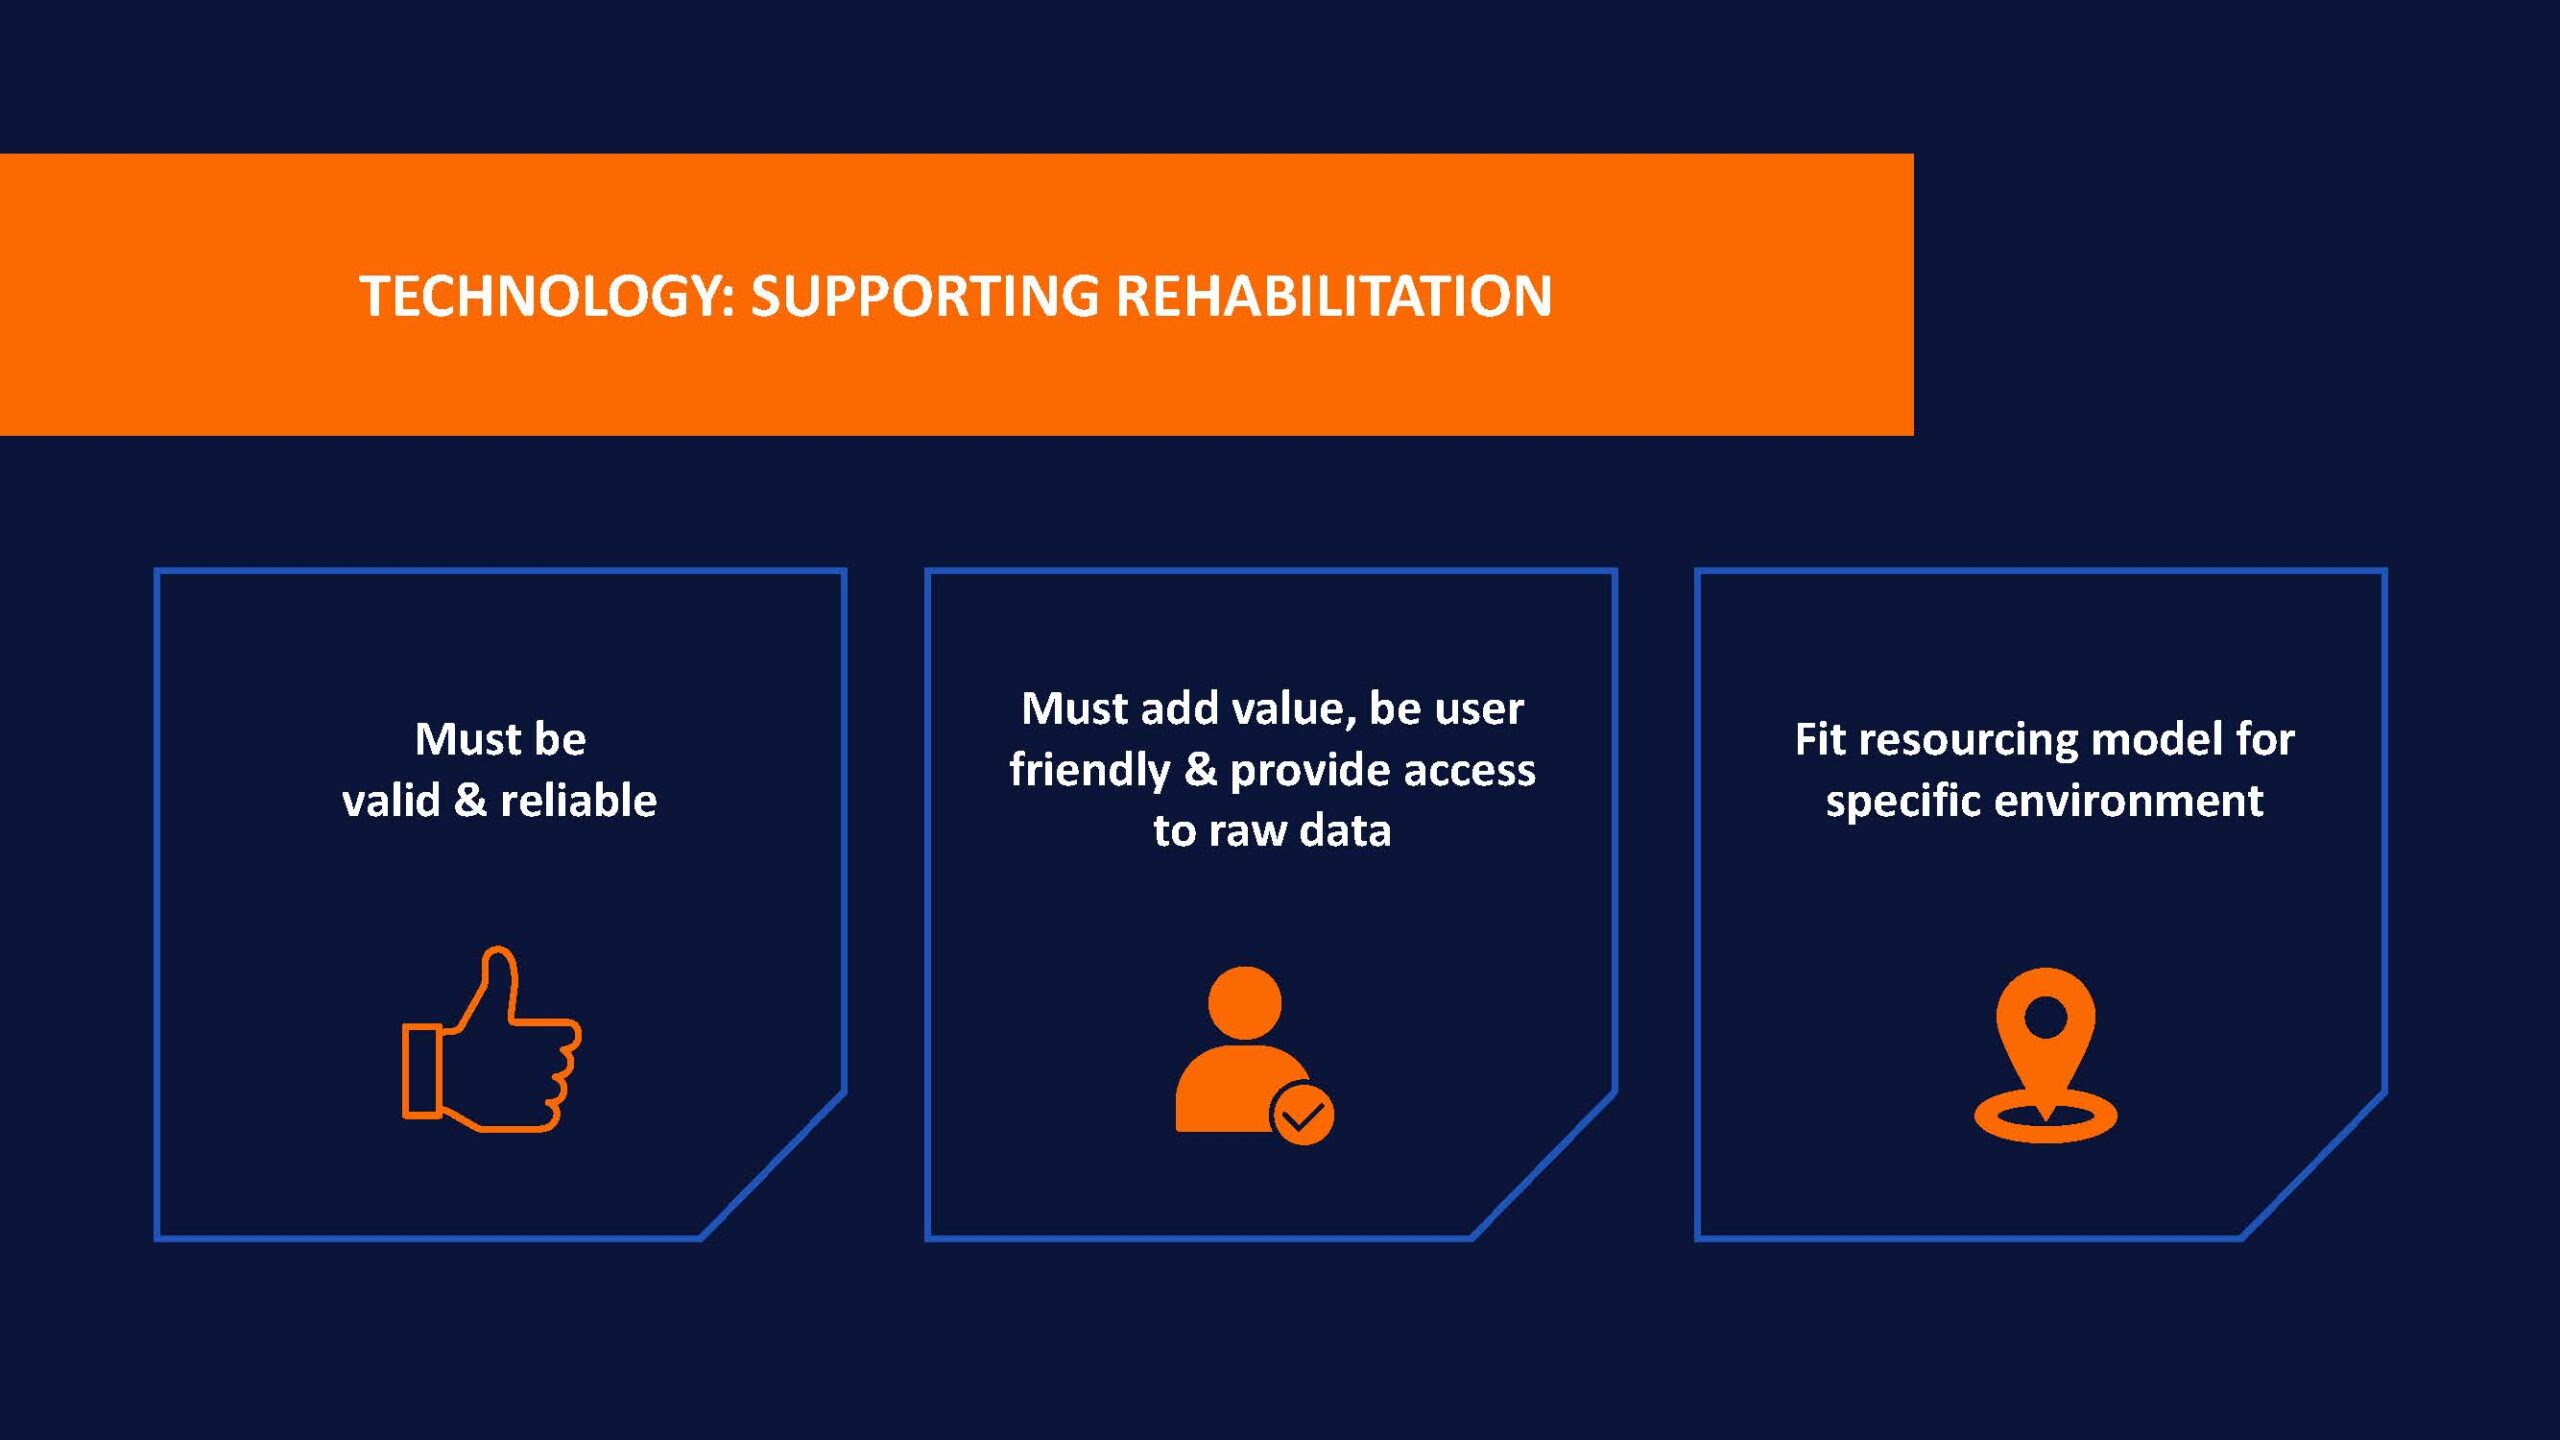
To start, you will need to choose what components make up your technology systems. The plethora of tracking technology in the market provides you with a lot of choice and plenty of data options. This can be a double edged sword though, it’s easy to become overwhelmed with data and let it distract you from your primary goal, improving the health and performance of your athlete or patient. To help evaluate new technology for the Tigers, Andrew has five non-negotiables that any technology must possess before being implemented. Every technology needs to:
- Be valid and reliable
- Answer a specific question
- Be easy to use
- Allow access to the raw data
- Fit the resourcing model
Andrew has 15 years of experience using player tracking technology in elite sport environments. This case study will walk you step by step through Andrew’s process of using the technology in your club or clinic. Specifically, we will walk you through labeling your data to ensure data integrity, how to create and integrate baseline data across tracking technologies, day-to-day sensor use, and objective data rehab principles.
Step 1: The importance of footnoting for data integrity
‘Footnoting’ is simply splitting the session into smaller chunks based on drills or exercises. Each organization will do this in different ways, with the overarching goal being to segment the data into informative and manageable chunks that make analysis easier and provide context to the numbers.
Undertaking this process retrospectively can be very time consuming and will be based on a lot of assumptions, potentially leading to a lack of data integrity. Therefore, it is important to think through your footnoting tags before collecting your first dataset.
“Footnoting allows you to get fully immersed in the detail of what has happened,” Andrew explains. “In IMU Step it’s called ‘footnoting’, in other tracking technologies it’s called ‘splitting’ or ‘portioning’. It allows context to be given to the data from a given activity.
“For years I collected data on athletes and then regretted that I hadn’t given the data more context with footnoting at the time. But unfortunately, it’s too late then. Without thorough footnoting, you’re just looking at blobs of data that you can’t attribute to a drill, activity, or physical quality.”
“I have seen people footnote their data using up to 15 different categories split up by underscores. This method allows you to form a different column in your output in programs such as Excel. Every time you add a different column, it gives you the option to slice and dice your data. I have settled on 6 which we use across both our player tracking solutions –
- Category (overall drill or activity type, i.e skill, conditioning, speed, match, game simulation, etc)
- Name (specific name of the drill or activity, i.e name given by the coach to describe drill/activity)
- Intensity/numbers of players (low, medium, and high, however ‘high’ can become a percentage of max. Numbers used when it’s a skills game, i.e 11v11)
- Dimensions/equipment (area size, i.e 5×5, size of box for plyometrics)
- Surface (what surface was the drill performed, i.e sand, grass, gym, track)
- Free (extra field for reps or other descriptors)
An example may look something like this – “gamesimulation_murderball_high_fullpitch_grass_”
Your footnoting system can be as simple or as complex as you need it to be, the most important consideration is that the footnotes will allow you to look at the data in a way that is meaningful to you and helps to answer your specific questions.
Step 2: Baselining with multiple technologies
Once you have established your footnoting labels, a natural next step is to establish baseline data for your subjects. This process puts you in a great position to better rehab your patients in the future and gives you a good understanding of where they are at now. As injuries inevitably occur, practitioners need to know how the athlete performed pre-injury. This allows them to set goals along the return to play (RTP) process with the aim of getting the athlete back to pre-injury levels and integrate them back into normal activity.
In the real world, you probably won’t be purchasing all of your technologies at the same time. As a result, you may have baseline data from one system but not another. It is a bit complex to translate between the two, but not impossible. For example, many beginning to use tibial mounted inertial sensors often have global positioning system (GPS) benchmark data they can use if consistent footnoting has taken place and the same process is replicated.
“A GPS system gives you location and time. But they also often have triaxial accelerometry. Whereas ankle mounted inertial sensors just have triaxial accelerometry. Therefore it’s difficult to utilize the location and time data, but what we can do is compare the accelerometry data collected at the thoracic spine and the data collected at the ankle.”
From the work we have done in this area, we know that they do have a generally linear relationship but they are collected at different locations so they will be innately different. They are also collected on two different devices, more often than not made by two different manufacturers with different sensitivity. But having both devices does allow for some really good baselining to occur and if your footnoting system is the same, deriving correlations is pretty easy.”
“The best time for that is during pre-season periods, performing repeatable standardized drills. We are capturing data on each healthy athlete for at least two days. If an athlete is then injured, we have some baseline data to work with. The whole purpose of a baseline is to be able to compare data from an athlete when they’re injured to when they are fit and get a percentage. If there are lots of change of direction (COD) movements in rehab, a suitable baseline would be multidirectional drills, not laps around a field”
As we add more systems to our athlete monitoring program, it is more and more important to integrate our testing and baselining as part of the training itself. This can save time and resources but more importantly, athlete energy to complete extra testing and baselining activities.
“Thankfully we have a great group of players and integrating the sensors for the purpose of baselining through pre-season is easy. Jess Adams, our sports scientist looks after all our baselining and all of our GPS and inertial sensor tracking. She explains to the players how they fit the devices so from there they fit the devices each day themselves.
We only have 10 sets of sensors available and rehab players always wear them. Whatever sensors are leftover from our rehab group are used for baselining. We capture a couple of days with each player so as many drills as possible are covered. We try to standardize things as much as possible but unfortunately, there are things that we can’t control which may affect data slightly. But we do everything in our power to control those baselining days.”
To ensure your IMU baseline data with inertial sensors is of the highest quality, Andrew recommends following the below baseline guidelines –
- Make sure the players are familiar with the positioning of the sensor
- Choose drills that replicate movements seen in training and competition
- Collect baseline data on as many drills that will be used throughout the season as possible
- Control as many variables as possible (playing surface, footwear, etc)

Step 3: Using the data day-to-day
The day to day monitoring of players is as much about setting up systems for success as it is about data analysis. Having the right systems means that quality data is collected on a consistent basis
As it is with footnoting, the system must be thought deeply about before any data collection takes place. Players should understand fully what part they play in the system, and so should each member of staff. Andrew explains his key points below
“The key points to our day-to-day monitoring are –
- Have a system where the players are involved
- Really good footnoting structure
- Have a plan for the session based on previous data
- Export data to allow comparisons
Players play a huge part in our data collection system even before they get on the field. They have to be bought into why we are collecting that data.
On a day to day basis, I like to funnel players through a set area before training and provide them with a clear explanation of what they need to do. We don’t have staff running around and chasing players, that’s stressful for staff and doesn’t create the environment that we want. I know that sounds like the perfect scenario but that is always our aim.
But no matter how hard we try, there are always bottlenecks to the system that we have to work on and overcome,” Andrew explains. “Getting footnotes from one system to another is often a bottleneck but I know IMeasureU is working hard to solve that at the moment.
As the players come off the field, the IMU dashboard is the first place that we go. The dashboard is used to understand the periodization of each of the rehab athletes. We look back on the retrospective data to see what got us to where we are today. We then use that to plan our next increase or decrease in load. That could be as easy as adding repetitions to a previous day’s drill.
Once we have interrogated the summary data (total load and asymmetry), we export that data into an excel dashboard and use that to compare drills vs previous days. The two main metrics we get from IMU Step are Impact Load and Impact Asymmetry. We then also get Impact Load per minute which is our intensity metric. Below is a Christmas tree graph from IMU Step for a 20-minute session and we can clearly see in the summary data that the difference between average right and average left is 2.88g and 14.52% asymmetry to the left (Impact Asymmetry = difference in asymmetry/sum).”
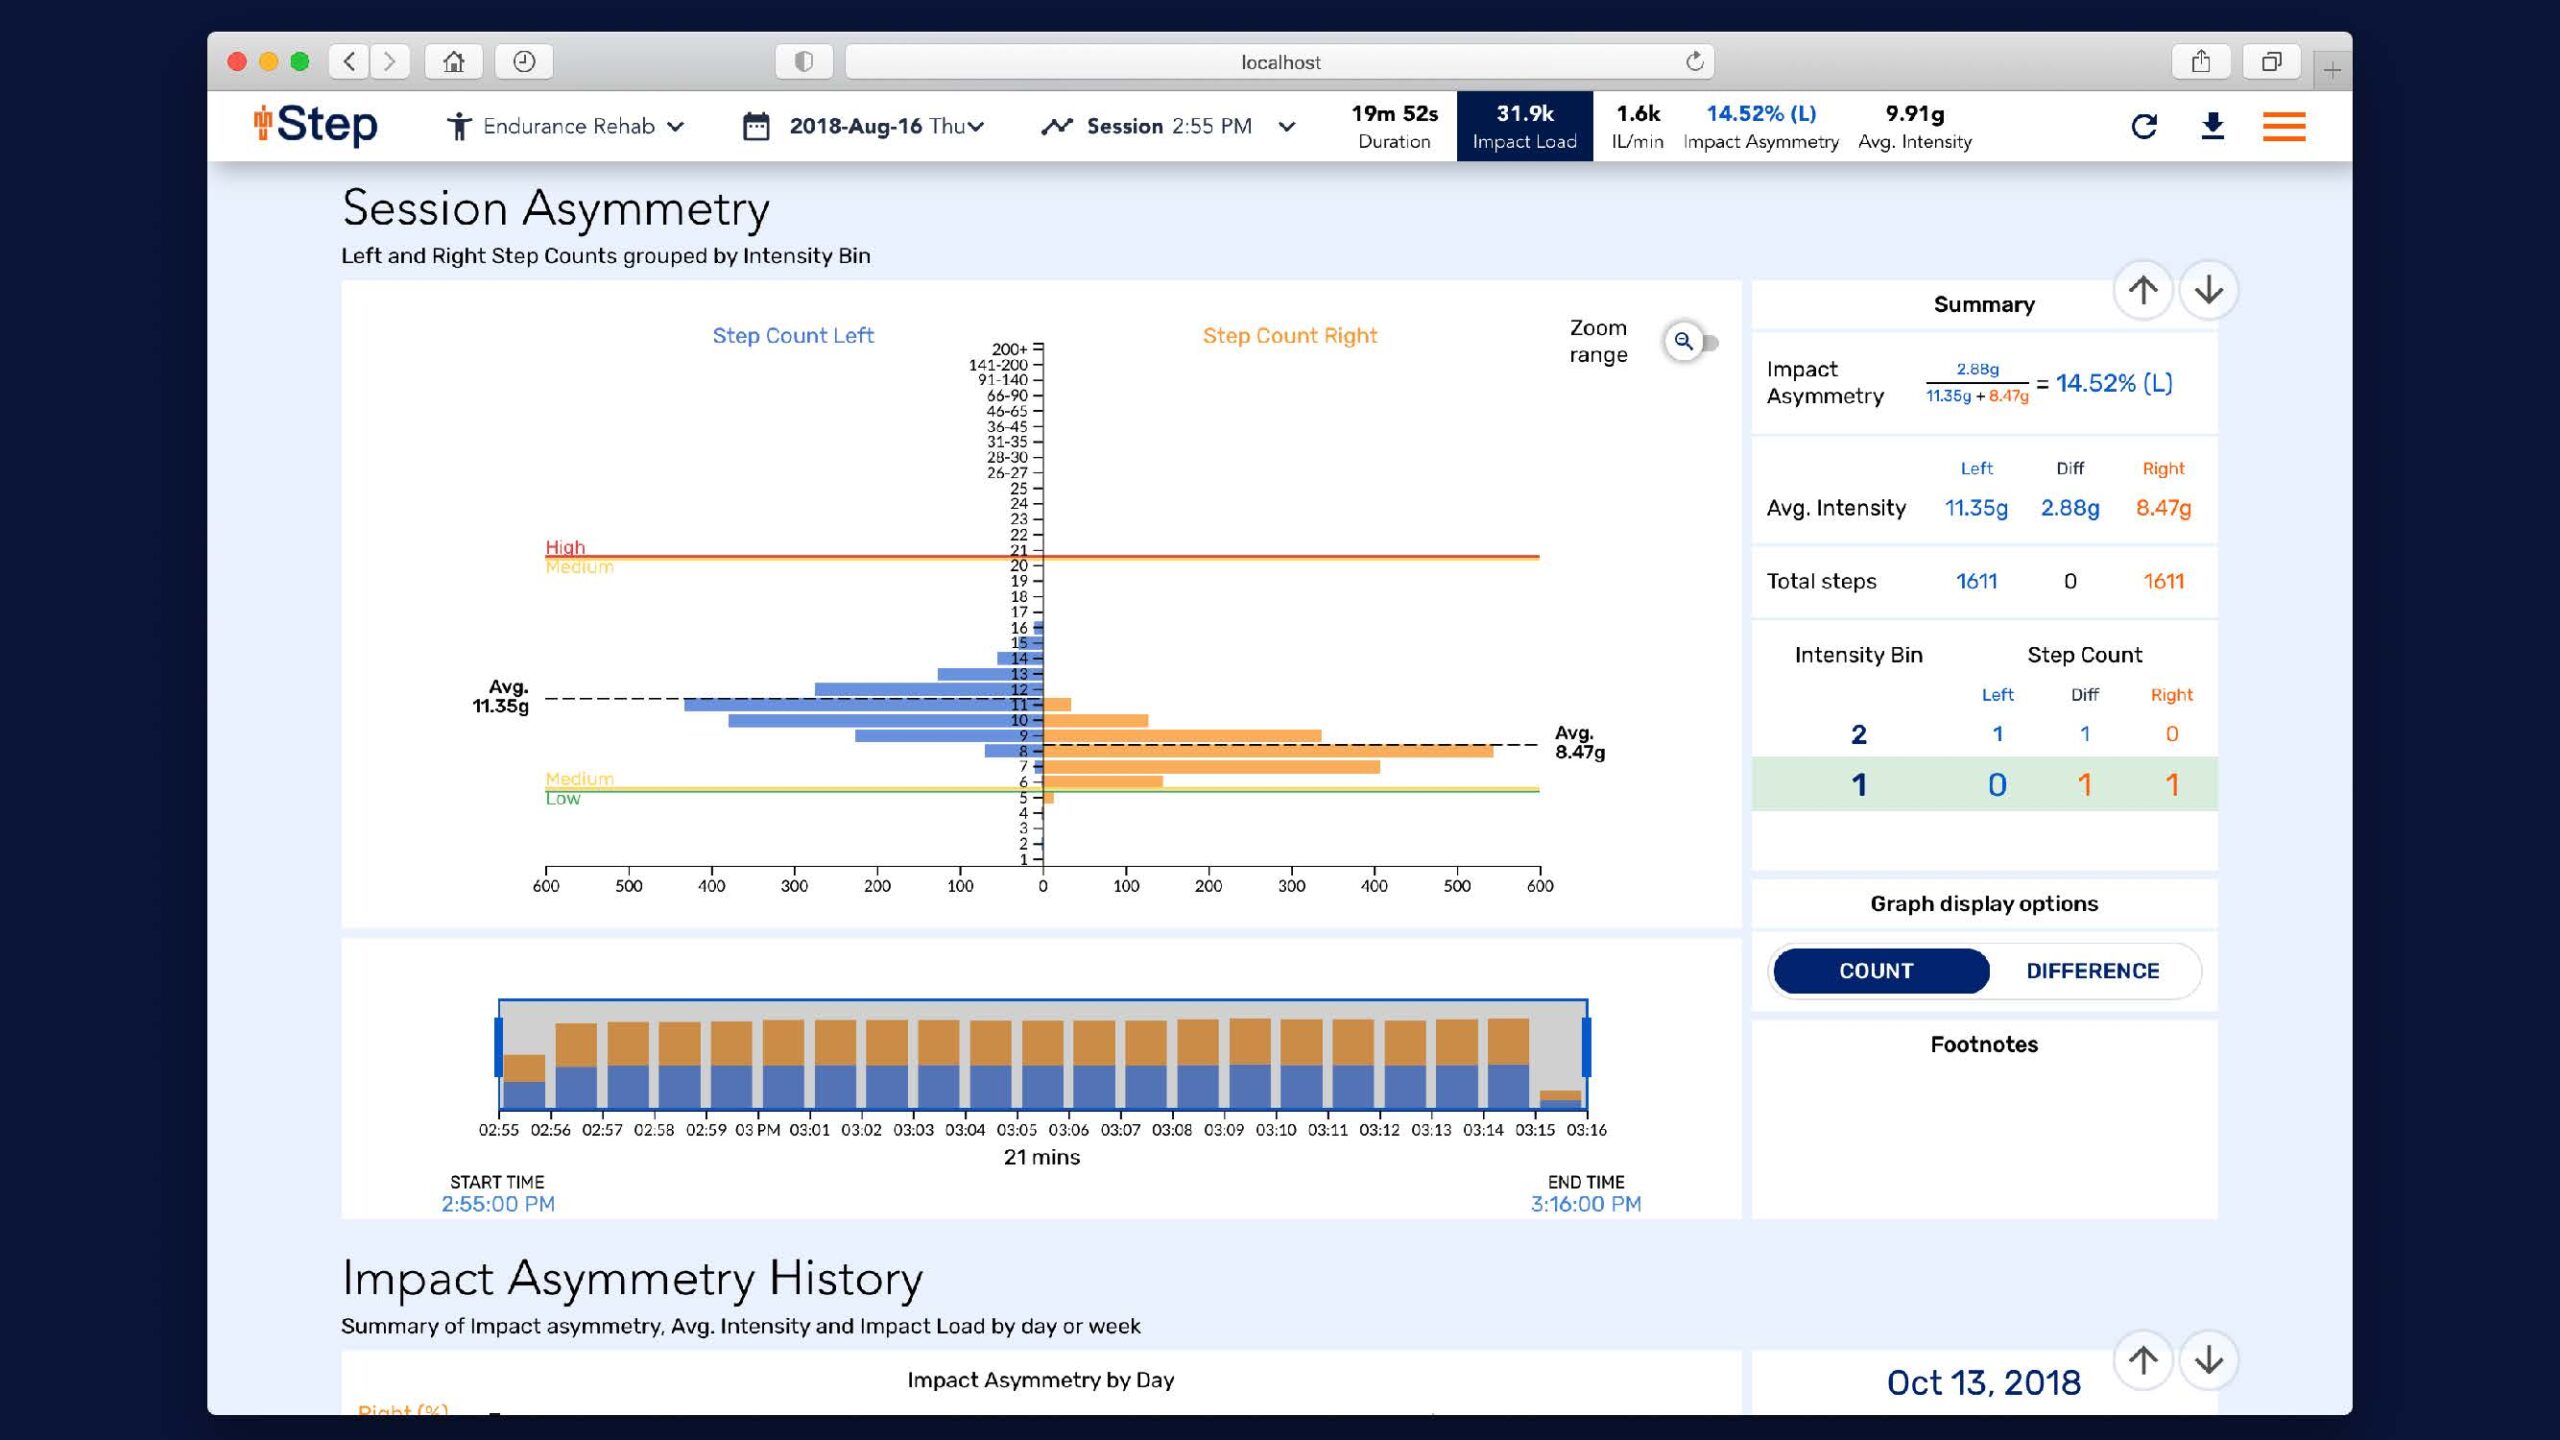
Figure 1: Session asymmetry summary
Part 4: Working with asymmetry
Every subject you track will present with some form of asymmetry. This is especially true for patients returning from injuries. It is because of this that Impact Asymmetry data has become an integral part of Andrew’s daily analysis.
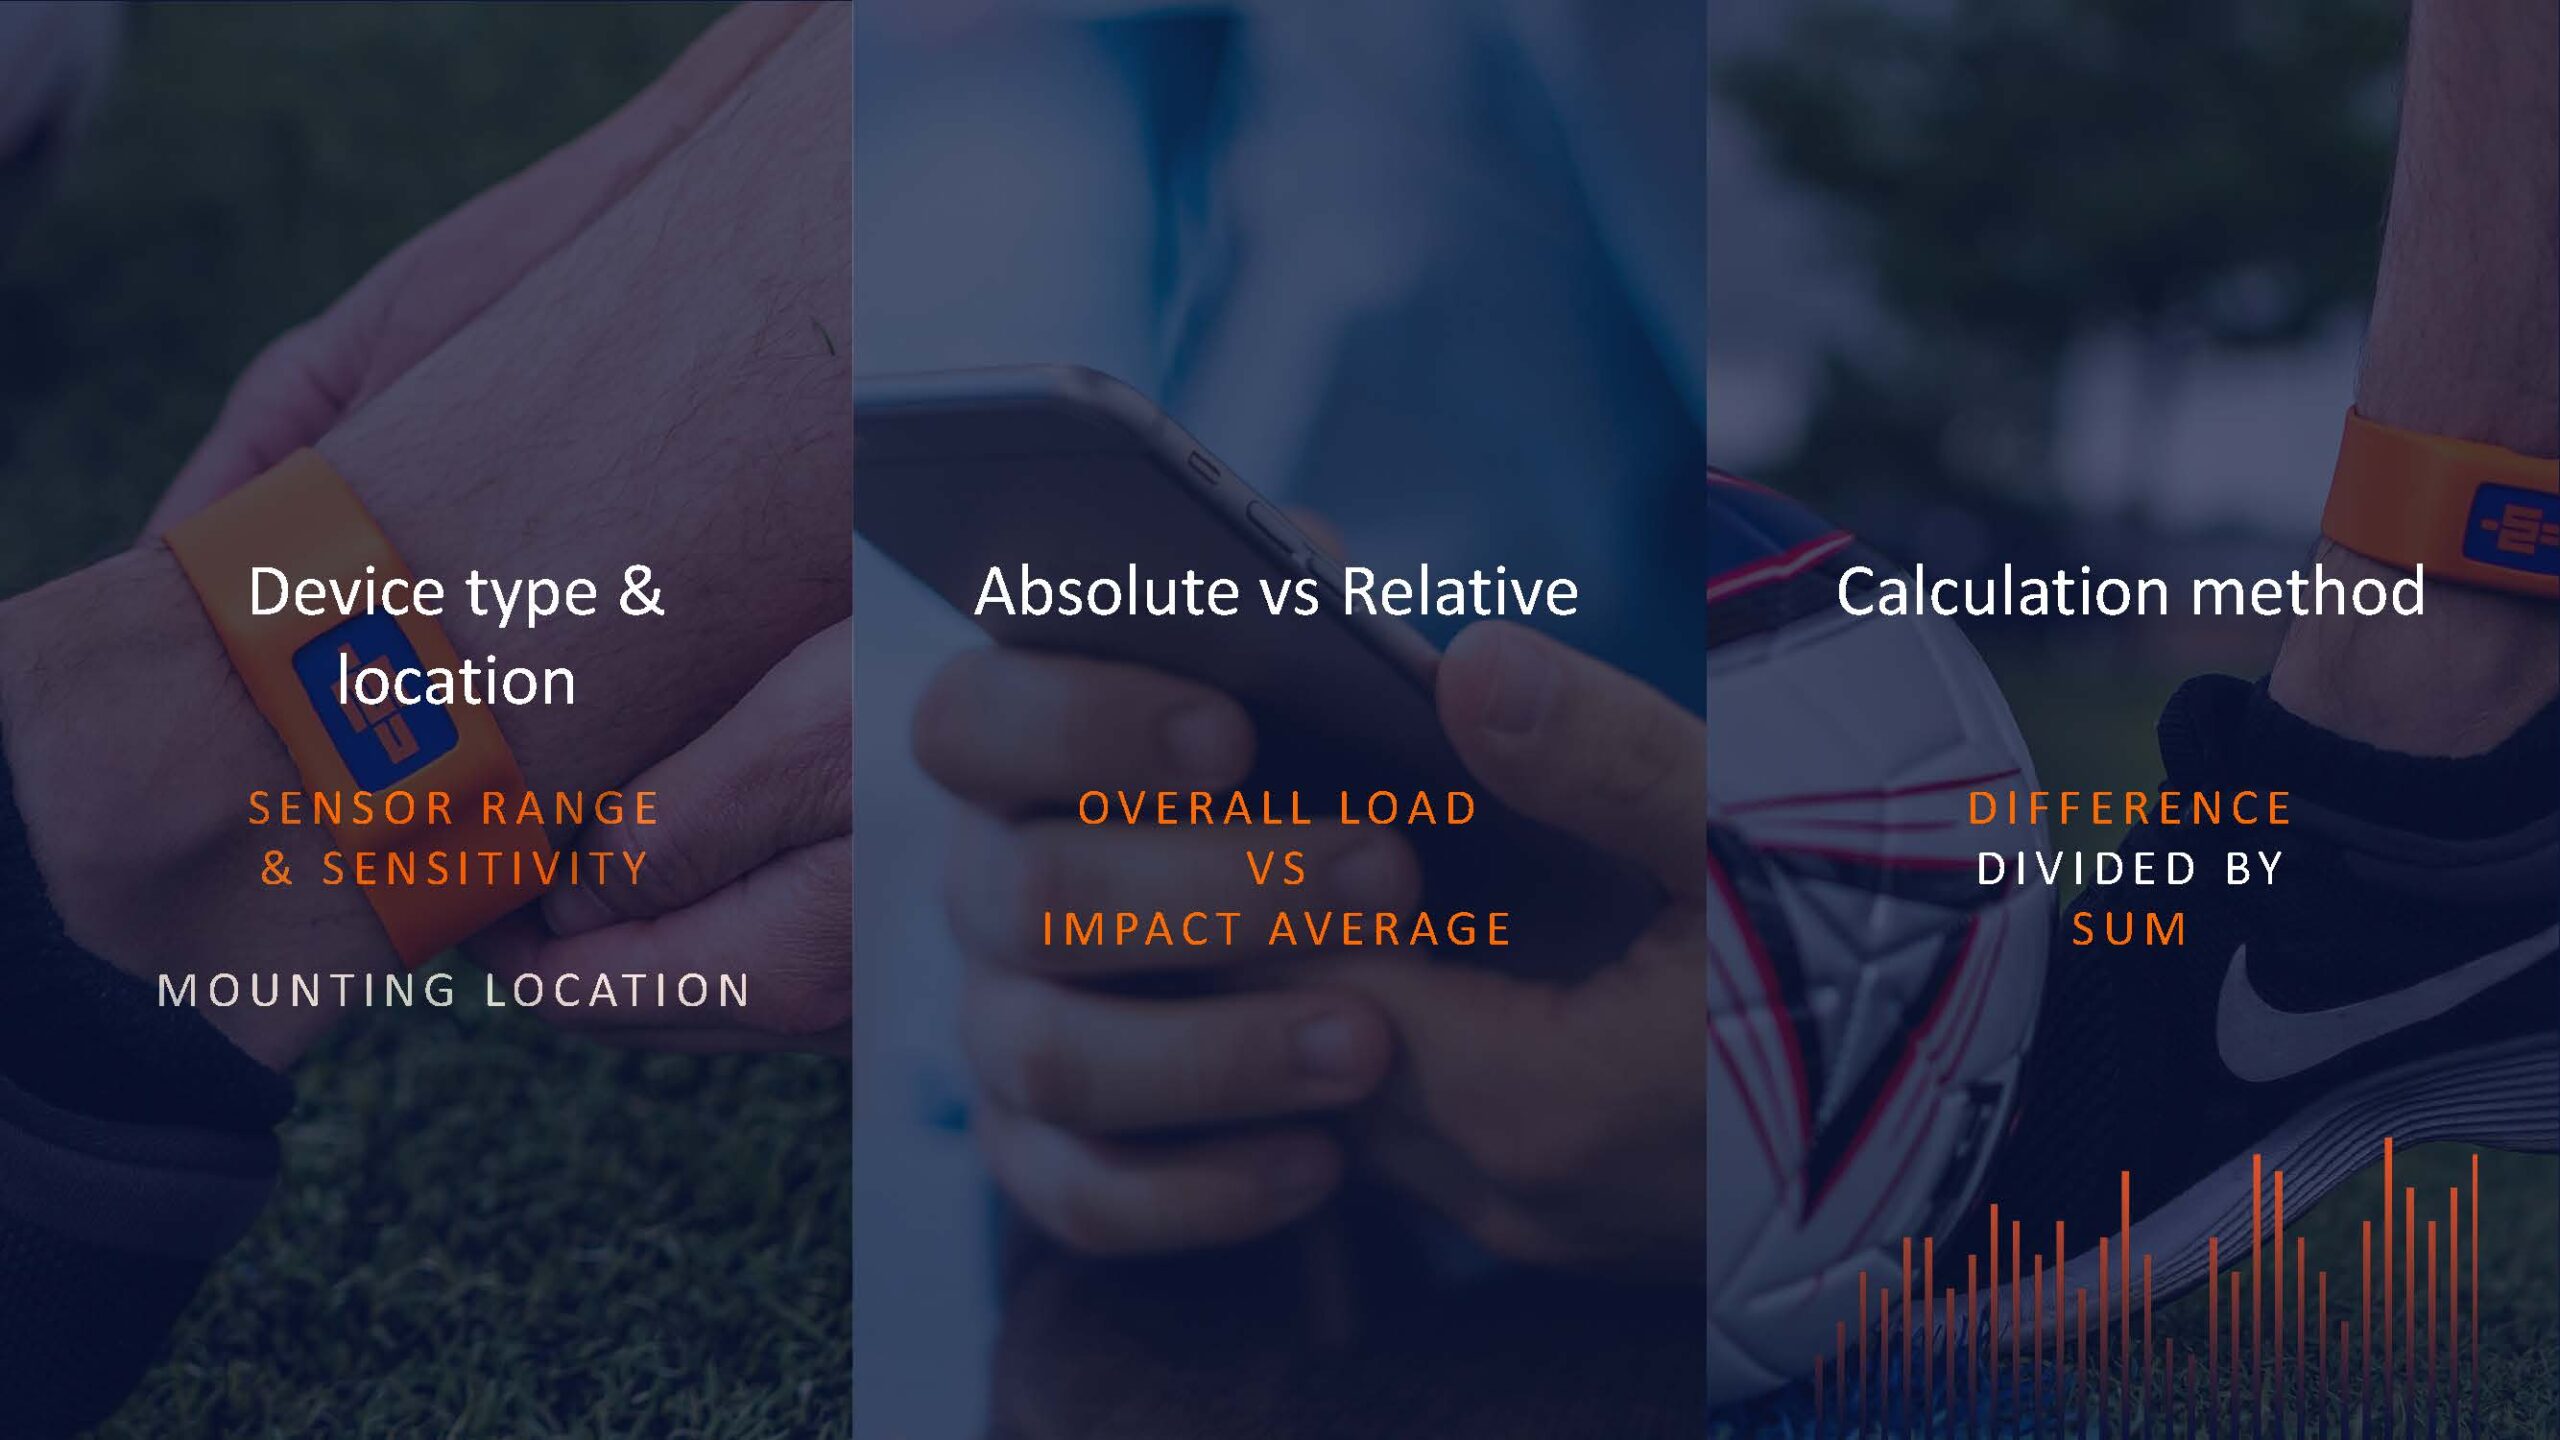
Asymmetries are not only used with rehab athletes, however. Changes in day to day asymmetries in healthy subjects may signify that there is an acute issue that could manifest and lead to injury. Let’s take a look at 3 aspects of asymmetry that will help you when you analyze the metric –
- Device type & location and the effect on the data
- The difference between absolute and relative asymmetry
- How asymmetry is calculated
“The closer the sensor is to ground contact, the more indicative the data is of ground contact. The further away it is mounted, the more opportunity there is for force dissipation through tendon extensibility, soft tissue force attenuation, joint rotation, joint mobility, etc.
If you’re measuring asymmetry from inertial sensors, sensor type is important and also the location. When a company switches from model A to model B and changes inertial sensor specification, the numbers will change. When comparing across manufacturers, numbers will change. When comparing across sensor locations, numbers will change. Intuition and experience would tell me that data collected at the thoracic spine would be lower than that collected at the ankle.
Once you have decided upon the location of the sensor, you need to decide whether you are collecting absolute or relative asymmetry.”
Absolute = difference in load from left side to right side. Relative = average left step vs average right step
Thankfully I don’t have to choose which one to use because I can collect both, but if I did it would be relative asymmetry.” Andrew states. In IMU-Step terms, absolute asymmetry is represented by the right and left Impact Load difference, while relative asymmetry is shown with the Impact Asymmetry metric.
The biggest question that arises when asymmetry is discussed is, ‘what is significant?’
“Having an athlete with perfect symmetry would make us think that movement is more efficient, injury risk is lower, and there is greater resilience to higher intensity activity. But the reality is that many athletes are asymmetrical. Old injuries and arthritic joints may restrict the range of motion and all athletes will have at the very least some small ongoing issues.
When I start with any new technology and we begin to run tests, I like to split things up into thirds or quarters. We usually find that ⅓ to ¼ of athletes are quite good at that activity. Roughly ⅓ to ¼ of athletes really need some intervention and then you’ve got that middle portion of ⅓ to ½ that could probably get better, but it’s not urgent.
So I tend to set the thresholds to catch the worst 25-33% and create an intervention for those athletes. In setting asymmetry thresholds from a thoracic mounted sensor, it seemed that around 2-2.5% was significant. Using that same logic for ankle mounted sensors, we have preliminarily accepted a 5% relative asymmetry as being our watch level. Anyone that has a greater than 5% relative asymmetry we will consider that it may require some intervention.”
When it comes to the data, Andrew doesn’t only hang his hat on a 5% difference from perfectly symmetrical, the difference from their asymmetry baseline is just as, if not more, important. If an athlete is consistently at 5% asymmetry and has been across their 10-year career with little fluctuation and few injuries, is that something that should concern us?
“What I have found with measuring asymmetry is that the day to day change rather than the fact they have a 5% asymmetry matters more. I have had lots of athletes who have had large asymmetries but have gone through their careers without significant issues and have learned to survive with them. But I have also seen athletes with significant asymmetries go from injury to injury to injury because they can’t handle the loading pattern.
When you are working with asymmetry data, Andrew recommends asking:
- Why the asymmetry occurred and can we do something about it immediately (manual therapy, altered drills, etc)?
- What is their norm and how does today’s asymmetry differ from that?
- Interrogate individual drills to see where the asymmetry occurs to gain context
Andrew has outlined more details about how he analyzes and employs Impact asymmetry in his recent webinar: Practical Examples of Using IMU-Step to Modify Outcomes: Asymmetry and Impact Load in the Real World
Part 5: Rehab principles
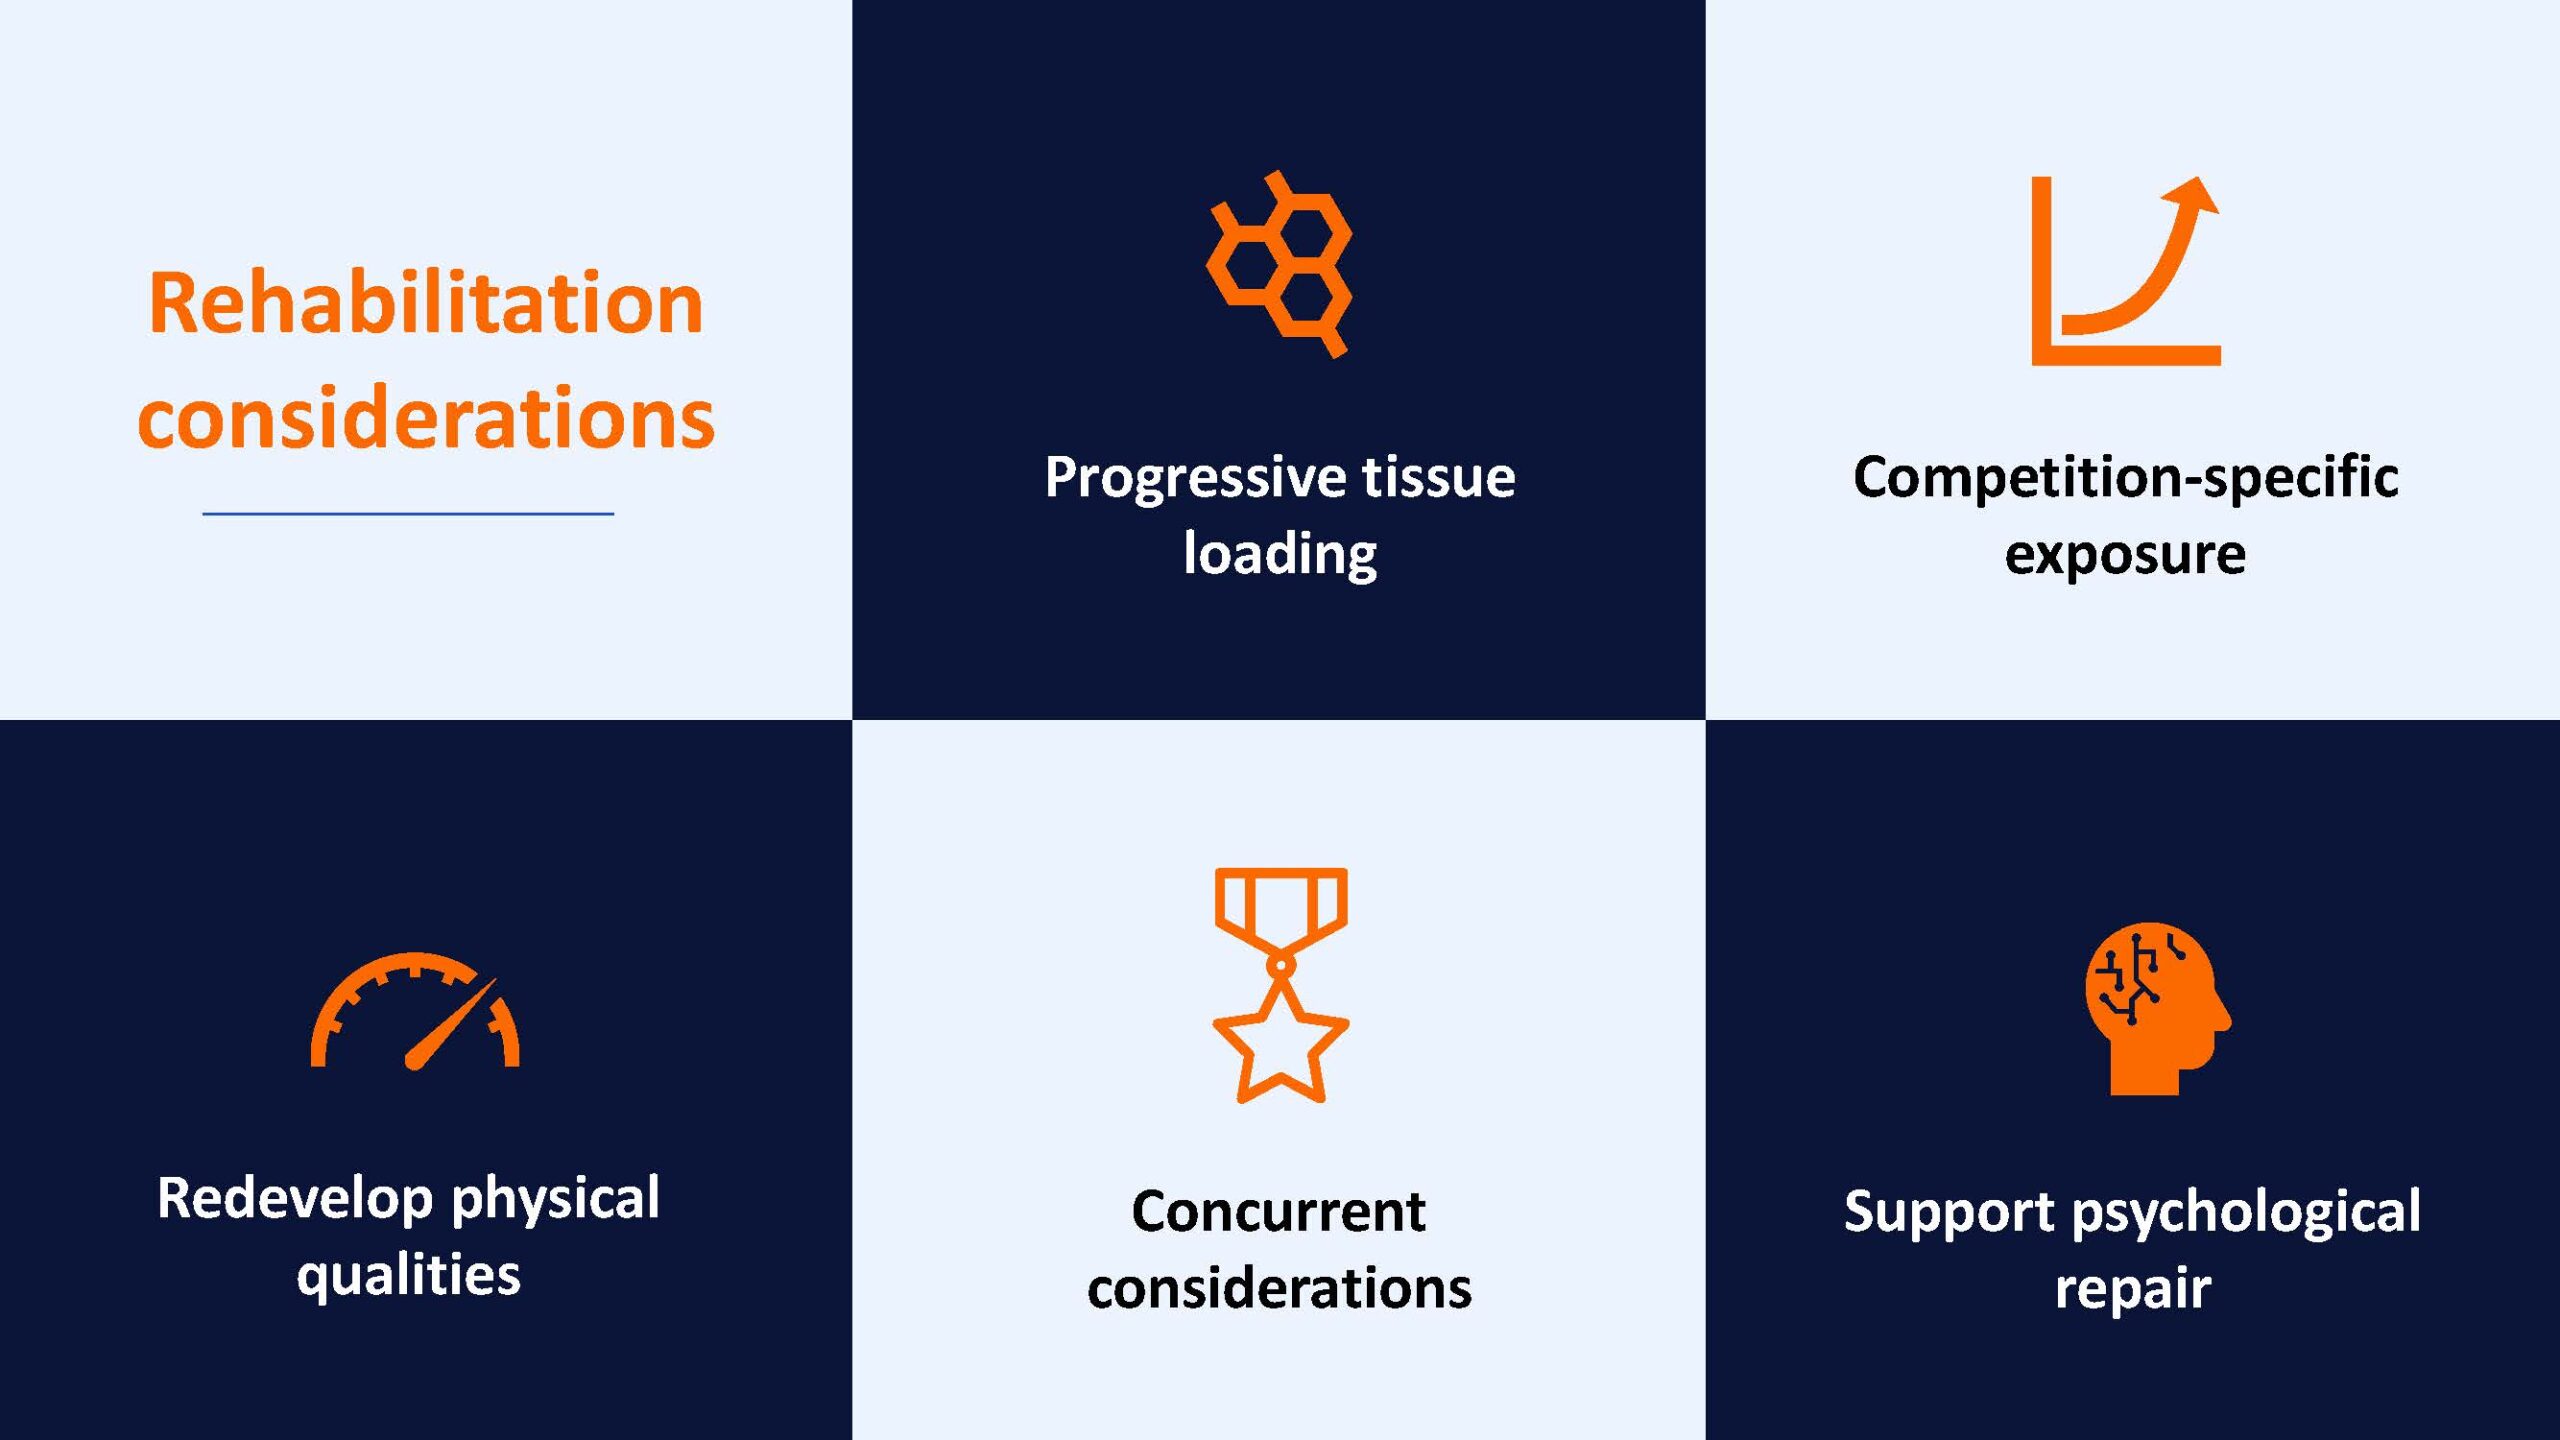
Having a clear philosophy and defined principles from which to work is what links all the best practitioners in the world. Andrew lives by these 5 principles when taking athletes through the return to performance process –
- Progressive tissue loading
- Competition – specific exposure
- Redevelop physical qualities
- Concurrent considerations
- Support psychological repair
But on a day to day basis, there is also an order of practice to guide programming decisions –
- What tissue was injured?
- How is it healing?
- How can we load it?
- Load it appropriately
- Assess the effect of the loading
- What can we do next?
“Inertial sensors allow the invisible to be visible throughout the rehab process. Technology takes the emotion out of the decision and supports the subjectively of the coach.
What asymmetry percentage are we happy with to return a player to performance? Generally, in a lot of strength measures, 90% of pre-injury level is acceptable but I am sure there are lots who return without that because of various factors.
When it comes to loading, I don’t like returning athletes to training if they have only been exposed to 90% of what they are going to experience in training or competition. We do not control training so have to overcook the rehab process to be completely sure it’s nothing new to them. When it comes to asymmetry, it’s not always possible to get athletes to a baseline and there is an element of calculated risk. But athletes have to be included when those risks are taken. And objective markers do help with those discussions when it comes to risk.
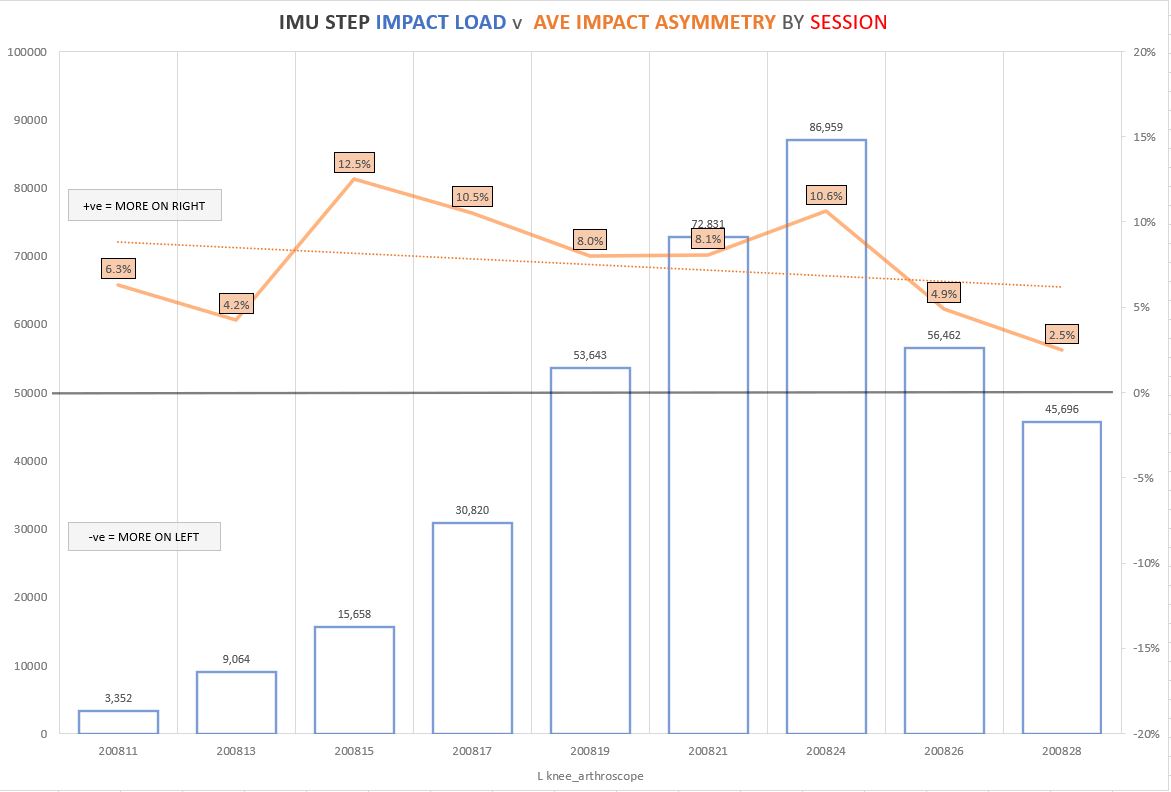
Figure 2: Impact Load and Impact Asymmetry data by session from athlete with left knee arthroscopy
As an example, figure 2 is an athlete after a left knee arthroscopy after long standing issues with that knee. You can see his asymmetry increase initially as his load increased and then you can see a steady reduction in the forth, fifth and sixth sessions. The seventh session took the athlete way over and above training demands which is why there was a temporary increase in asymmetry. The final two sessions are team training which again shows a decrease in asymmetry to a much more acceptable level.
And finally, figure 3 shows the loading and asymmetries present across various drills for a player post mid foot surgery. Without a footnoting structure and just looking at the global session wouldn’t give us the opportunity to get into this detail. This information helped us guide his rehab, especially in the drilling, multidirectional activities and accelerations.”
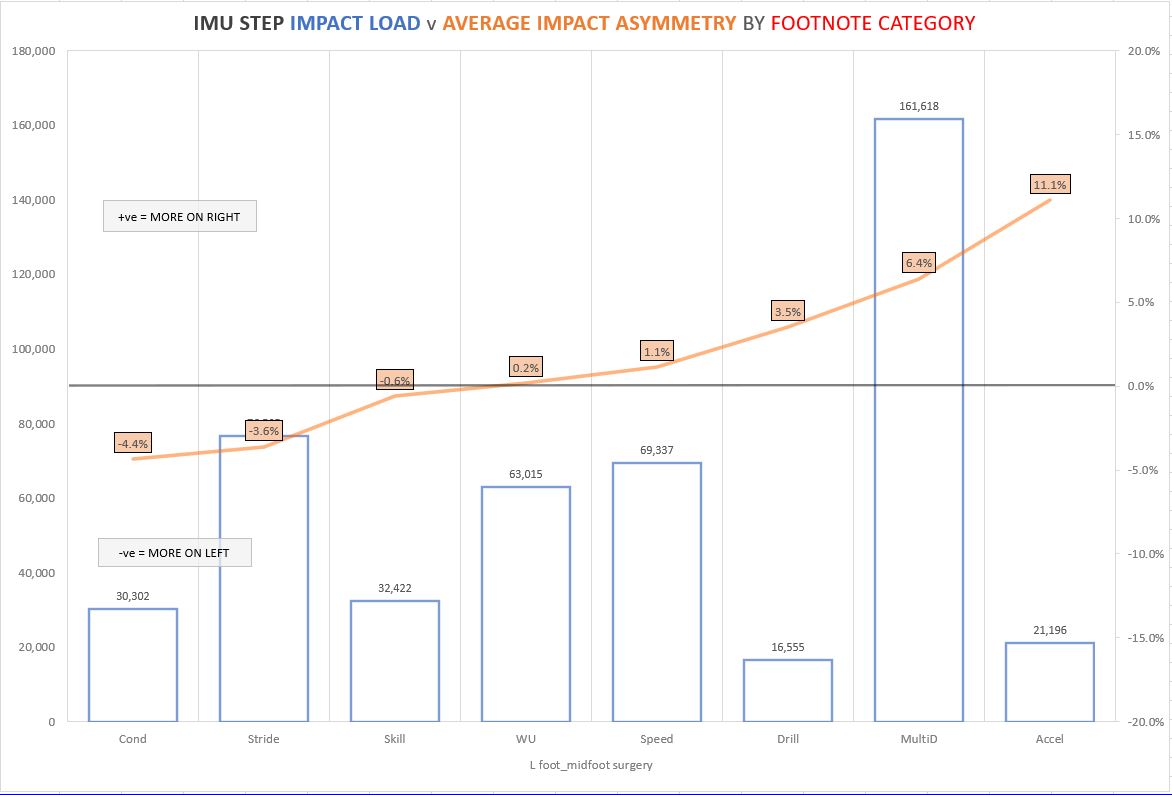
Figure 3: Impact Load and Impact Asymmetry data by footnote category from athlete post left midfoot surgery
These five steps hopefully give you an insight into how one of the most experienced practitioners in Australia integrates inertial sensors within his monitoring system. Use these tips to help wrangle your data collection methods and help direct them towards the most important goal you have – improving the health and performance of your athletes or patients.
In addition to working as the High-Performance Manager for the Wests Tigers, Andrew also works as an Applied Scientist for IMeasureU. If you have any questions for him or the team, please get in touch with us through this link.
Learn more
This case study builds on concepts we’ve explored in-depth at IMeasureU. Follow the links below to learn more –
Practical Examples of Using IMU-Step to Modify Outcomes: Asymmetry and Impact Load in the Real World – a webinar with Andrew Gray
Understanding External Biomechanical Load During ACLR Rehabilitation – A webinar with Mark Armitage
Managing the Mental Side of Injury During Quarantine
Have an injured athlete? Get in touch with us and ask about a free demo of IMU Step to see how we can help your return to play.