By Mark Armitage, Lecturer in Strength and Conditioning at the University of Suffolk & Consultant Rehab S & C Coach
Despite dramatic increases in staff resources, facility enhancement, and technological developments, injury rates in football have not reduced for a number of years, with reinjury rates remaining high. This suggests that there is still a lot to learn about on-field rehabilitation processes, particularly with regards to drill selection and progression.
At present, most practitioners quantify field-based rehabilitation using Global Positioning Systems (GPS) which have been shown to be valid and reliable at measuring external running loads (e.g. distance and speed). Whilst to date this information has been invaluable, practitioners have perhaps become over-reliant on it in isolation and now might be the time to support it with new technological innovations that offer additional insights into external biomechanical load.
Jaime Valadao provides a breakdown of this case study in this 10-minute video review
Having spent the last 10 years or so working with professional football players and using technology to monitor and manage training load and return to play (RTP) protocols, I found myself asking “so what”. For example, if one player covers 5km and another covers 6.5km what is the difference? 1.5km? But what if the player covering greater distance is ‘fitter’ and ‘stronger’, have they done more, the same or less work relatively? What was the ‘cost’ of the activity? Likewise, in rehabilitation what actually happens if a player ‘spikes’ in load from 50m to 750m high speed running (HSR)? Hopefully, in this case study we’ll find out.
"This case study will use GPS data in conjunction with that from IMU Step to see if we can start to bridge the gap between describing activities and explaining them"
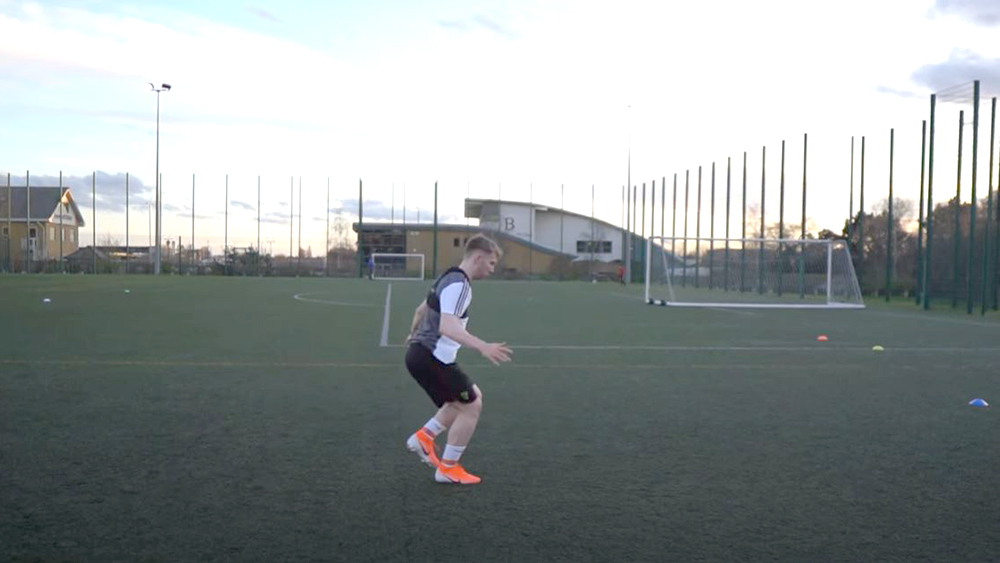
This case study will use GPS data in conjunction with that from IMU Step to see if we can start to bridge the gap between describing activities and explaining them. It will illustrate working examples of a field-based rehabilitation process with a young (21 years) male semi-professional football player who was recovering from a left anterior cruciate ligament (ACL) rupture. Unfortunately, this was the player’s second experience of such rehabilitation having suffered a right ACL rupture some five years earlier whilst contracted to a professional club.
ACL injuries are extremely impactful (e.g. to future performance and potentially quality of life), complex (e.g. lots of potential causes and complications) and challenging (e.g. high chance of re-injury) to rehabilitate. In this case, the knee was still in a state of healing (e.g. hot, swollen and discoloured) upon first contact, due to a delay to specialist intervention (5 months) post-surgery. Furthermore, a second operation required a break in exercise-based rehabilitation to clear a scar tissue blockage preventing full extension.
Initially practitioners supervised all field-based sessions. However once they deemed the athlete competent in gym-based rehabilitation (not reported in this case study) they trusted the player to complete such work independently. Following 5 months of indoor rehabilitation and achievement of a return to running criteria (not reported in this case study) the commencement of a running-based progression continuum took place (Figure 1). Progressions 1 and 2 were completed twice due to a Christmas break, during which the focus returned to gym-based rehabilitation and increasing left quadriceps bulk and improving symmetry (both between limbs and quadriceps/hamstrings).

Figure 1 - Running-based progression continuum
Table 1 reports some of the GPS and IMU Step metrics from repeating progression 2, from which it would appear that on the second occasion the player covered more distance but with a reduced impact load (IL), and an improvement in limb symmetry (19% vs. 28% difference). Total steps (TS) remained relatively similar but high intensity steps (HIS) reduced between sessions A and B, with medium intensity steps (MIS) increasing. Accumulatively these differences would indicate that the player achieved more work for less mechanical effort. It is acknowledged that these differences could be a result of chance or a change in surface and/or footwear, however it could also be indicative that the player became more efficient as a result of improved tissue healing, increased confidence and/or greater strength.
Table 1 - GPS and IMU Step outputs from the same session twice in the rehab period. BS = bone stimulus, IL = impact load, TS = total steps, LIS = low intensity steps, MIS = medium intensity steps, HIS = high intensity steps

Whilst this notion needs to be confirmed through vigorous scientific investigation, other examples of improved symmetry were present in the dashboard output for left and right steps grouped by intensity for count (Figure 2) and difference (Figure 3).
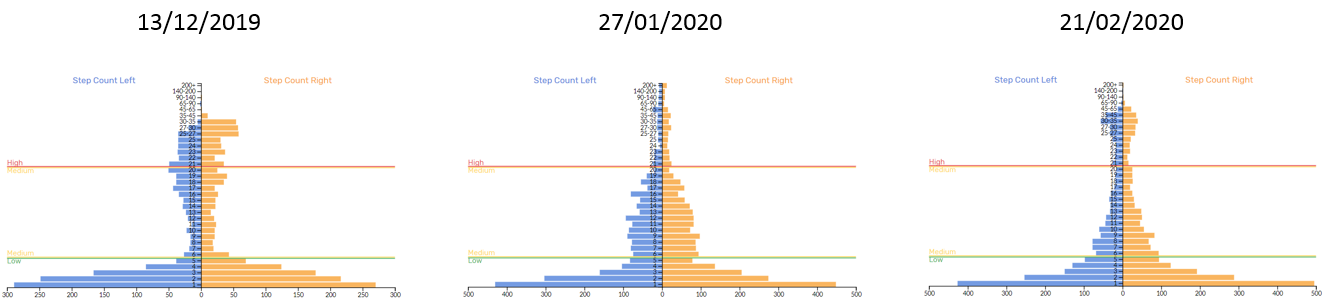
Figure 2 – IMU Step left and right step count
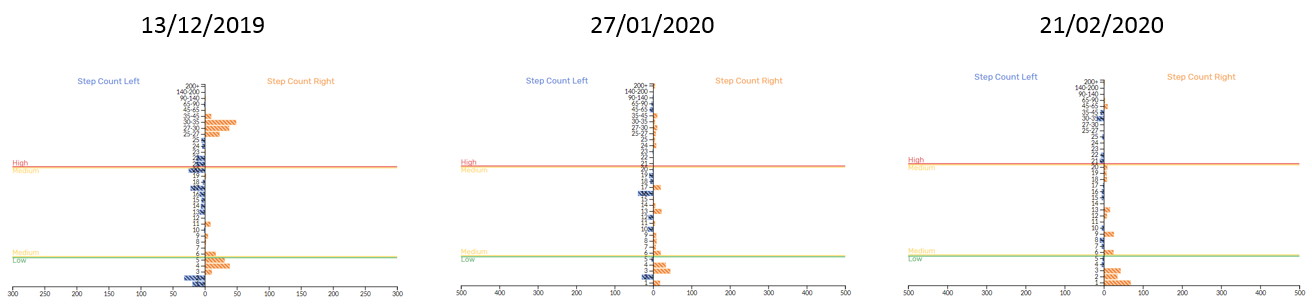
Figure 3 - IMU Step left and right step difference
Each session contained different drills and activities but from looking at these graphs it would appear that symmetry between limbs was improved. We selected these sessions for analysis because they preceded laboratory based isokinetic testing (Figure 4) which also demonstrated improved strength and symmetry over the same time course. Interestingly, limb differences for IMU Step metrics IL, bone stimulus (BS) and HIS (≥ 21.5 g) in field-based rehabilitation sessions followed a similar trend to isokinetic dynamometry (Figure 5). The difference between limbs appeared to become larger for low intensity steps (LIS) (≤ 6 g), with there tending to be a general downwards shift between bands. For example, session 1 generated mostly MIS (≥ 6 and ≤ 21.5 g) and HIS, session 2 mostly LIS and HIS (i.e. MIS transitioned towards LIS), and session 3 was relatively even (i.e. HIS partly transitioned back to MIS). Although only a single case study and achieved through the completion of different tasks this data suggests a reduction in step intensity despite an increased workload e.g. distance, HSR and accelerations (Figure 9).
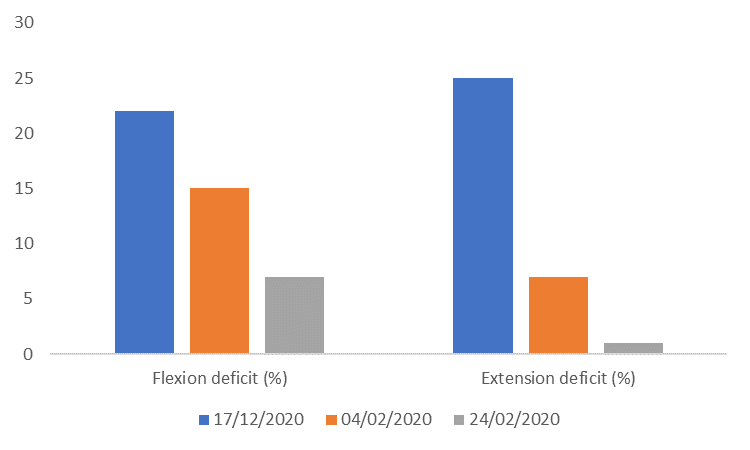
Figure 4 - Isokinetic limb deficit for isokinetic knee flexion and extension at test points one, two and three
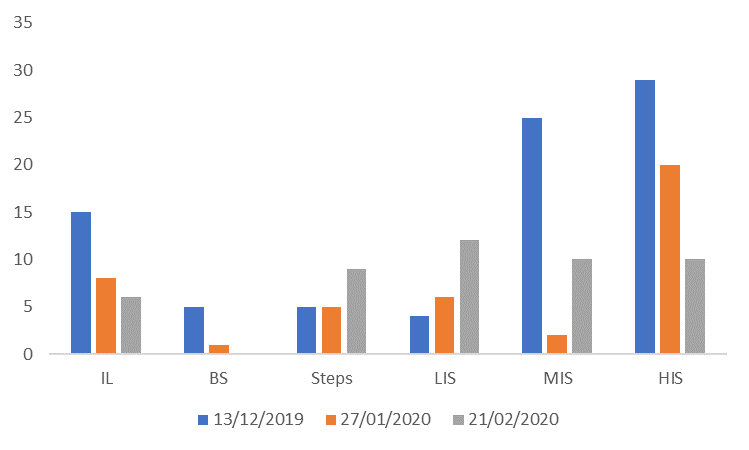
Figure 5 - % difference between limbs in IMU Step metrics from sessions before isokinetic testing
The tendency of the player to favour their dominant right (or non/previously injured) leg during LIS throughout this period of rehabilitation and at an increasing rate is further highlighted in Table 2. For MIS, initially they performed more steps on their left leg before shifting to their right, something which was the opposite for HIS. With the absence of pre-injury or normative data to indicate what might be ‘normal’, they presented some clinical differences. During early stage isolated limb drills (e.g. single leg knee drives) the player appeared to be able to complete more repetitions over the distance with the non-injured leg due to greater technical proficiency, creating objective feedback and coach-athlete discussions. While the coaches addressed these through on-going drilling, coaching and improved tissue state, overall LIS continued to raise stimulating questions around ‘acceptable asymmetries’. As sessions continued to increase in duration and drill complexity, did the player experience more natural opportunities to favour their dominant limb in completing low magnitude changes of direction? Furthermore, in kicking sports this action would logically influence accelerations, which might create a certain amount of ‘noise’ researchers and practitioners need to research to filter impactful clinical decisions (i.e. what might be meaningful step intensities and differences between limbs and bandings?). As to why the player experienced more MIS on their left leg, perhaps this could be explained by restricting HIS during the early stages of rehabilitation (Figure 7) and a potential off-setting and poor absorption effect. For example, the athlete preffered the right limb when time and task allowed (i.e. at lower intensities), but when this wasn’t the left limb could not absorb forces appropriately, creating an almost ‘slapping’ effect.
Table 2- Difference between limbs for LIS, MIS and HIS during field-based sessions which preceded isokinetic testing
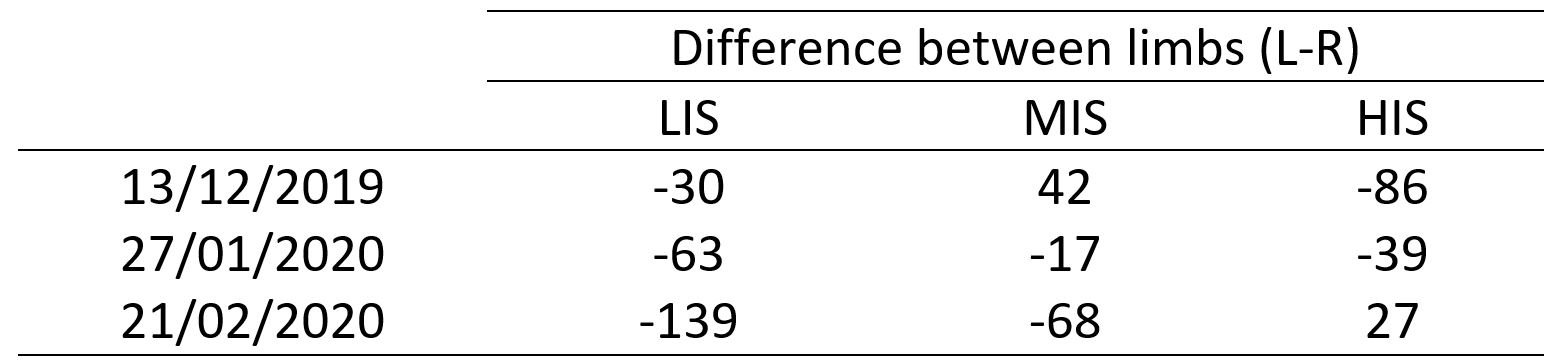
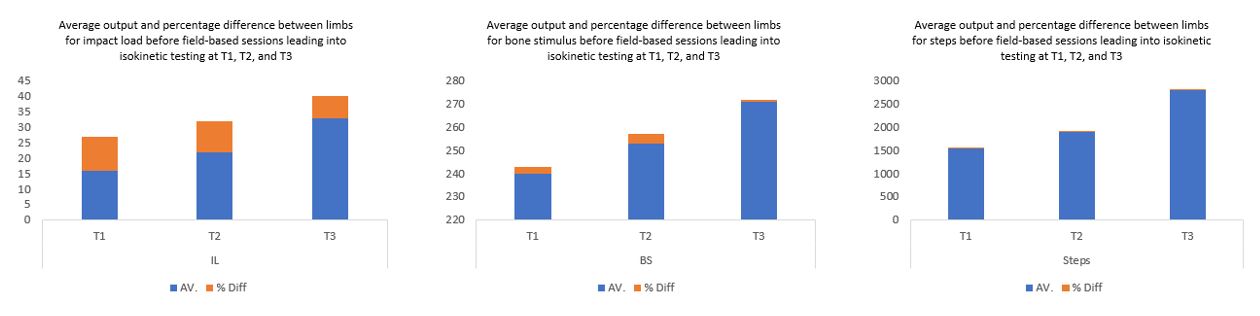
Figure 6 - Average outputs (i.e. all sessions before selected isokinetic testing) and difference between limbs before isokinetic testing one (T1), two (T2) and three (T3)
To give Figure 5 more credence and move away from single session data, we calculated the average outputs from each session leading up to isokinetic testing against the average percentage difference (Figure 6). Across each metric (IL, BS and TS) there is a clear increase in workload (size of blue bar) with a concurrent decrease in percentage difference between limbs (size of orange bar) for IL and BS, whilst that for TS remained constant. This once more reinforces a reduction in asymmetry with increased capacity, something which held true across the rehabilitation period. Figure 7 illustrates all sessions’ asymmetry with regards to a heatmap showing asymmetry by intensity bin for every session. Initially, volume-based steady state (via relatively long, slow intervals) runs reduced exposure to higher intensity steps (top-left grey area), something we progressively overloaded through manipulations in movement speed and complexity. As the player transitioned through sessions the colour of the graph lightens, despite overloads in magnitude (Figure 8), further reflecting a reduction in asymmetries between limbs.
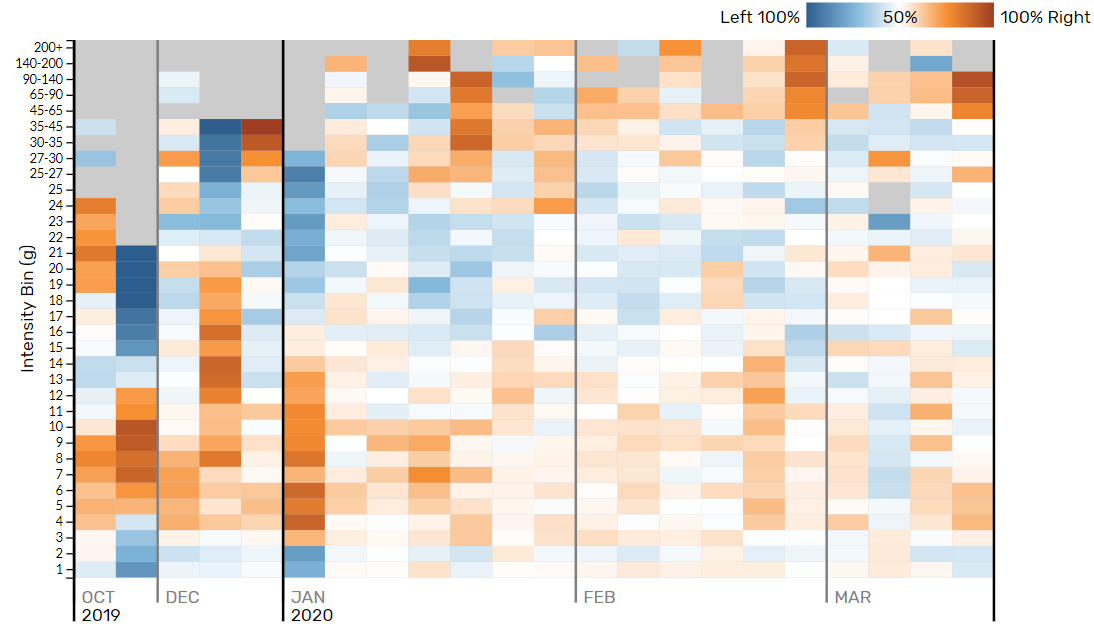
Figure 7 - Heatmap demonstrating asymmetry by intensity for every session recorded
Figure 8 illustrates BS, IL, LIS, MIS and HIS steps across the field-based rehabilitation period. Both BS and IL increase in an undulated manner to create periods of overload (stimulus) and underload (recovery) in order to facilitate adaptation. For the first 11 sessions we overloaded IL gradually to afford the skeletal system (i.e. BS) time to adapt to the imposed stresses. BS appeared to plateau across sessions 7 to 11, potentially due to differences between the metrics (i.e. IL and BS). Bone Stimulus reflects the saturation effect of bone tissue where bone response levels-off despite repeated cycles of loading. IL on the other hand, is a linear metric in that it will alter depending on the impact magnitude of a given number of steps. As the player transitioned through the rehabilitation process, BS responded in-line with increases in movement demands and complexity which resulted in more higher magnitude steps (i.e. IL). While practitioners use both BS and IL to assess differences between sessions and potentially how the bone (i.e. tibial stress) responds to external forces (e.g. number and intensity of steps), only IL is an indicator of activity or drill intensity. This is because the footnote function splits the linear component (Figure 10), whereas BS continues to accumulate (albeit at a lesser extent with increasing duration) across a session with the overall output mirroring that of the last activity (i.e. BS on the last drill incorporates that of the first because it has contributed to the overall stress on the tibia at that point).
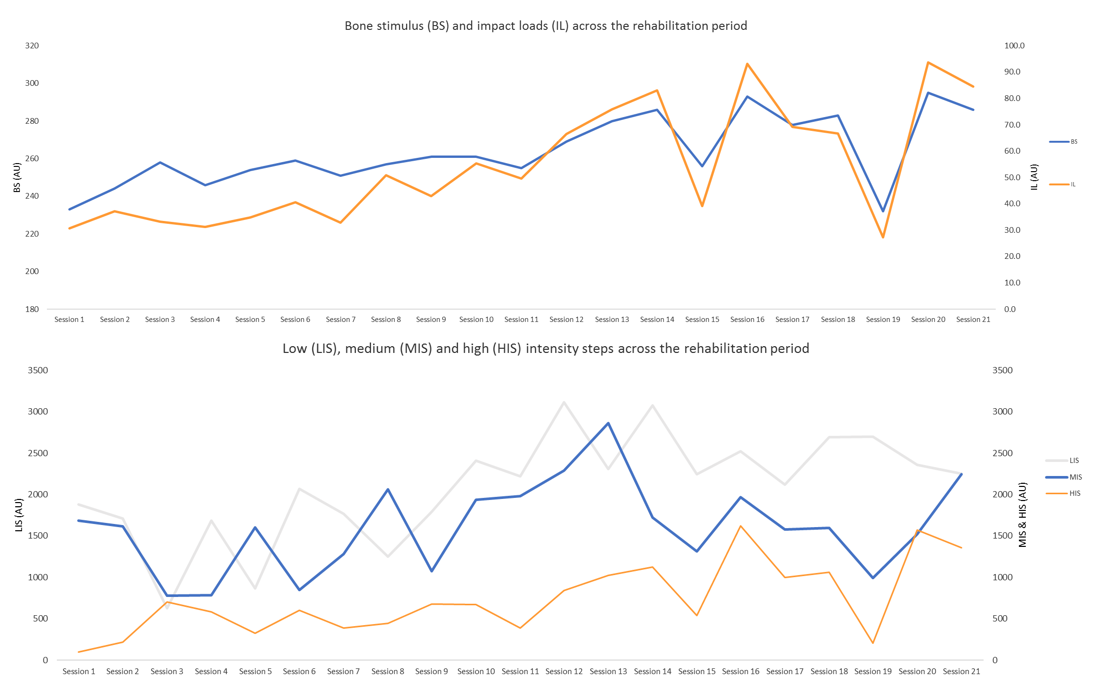
Figure 8 - IMU Step metrics (bone stimulus, impact load and individual step intensity zones) across the rehab period
After session 11 there is a clear turn-point with sustained increases in BS, IL, MIS and HIS, which continued to be applied in an undulated manner. This increase in high intensity action was supported by subsequent improvements in isokinetic testing and achieving < 10% limb symmetry index for hop and jump tests (data not presented). Whilst IMU Step metrics appeared to be progressively smooth in nature, GPS data contain two noticeable ‘spikes’ in load (Figure 9). The first coming for total distance (TD) during session 12, and the second for HSR during session 13. Whilst there is an increase in IL (Figure 8), as with TD and HSR (Figure 9), the ‘spike’ appears a lot less abrupt (e.g. IL = 50 to 67AU (Δ 17AU or 29%) to 83AU (Δ 16AU or 21%); TD = 3102 to 5049m (Δ 1947m or 48%); HSR = 54 to 767m (713m or 174%)). This suggests that although external running load metrics (i.e. TD and HSR) are vital in the quantification of field-based rehabilitation practices, giving them context through simultaneously using other technologies yields greater insights into external biomechanical load (e.g. IL and BS).
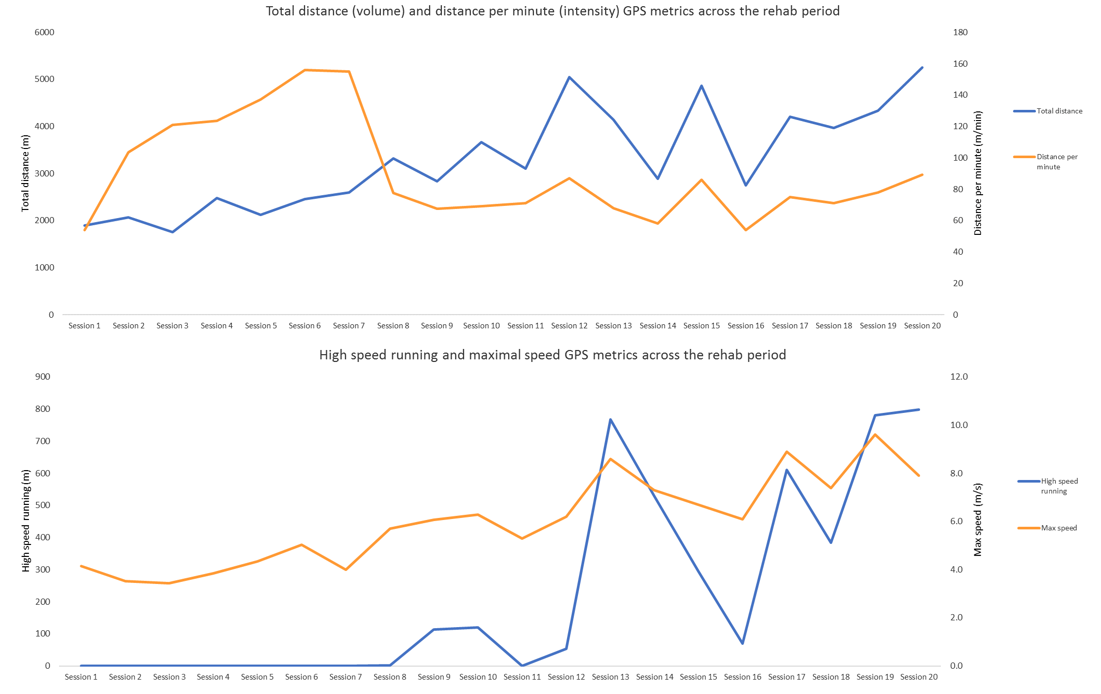
Figure 9 - GPS metrics (distance, distance per min, high speed running and maximal speed) across the rehab period
In this case study, this approach gave the coach and player great confidence and reassurance when reviewing the HSR outputs from session 13. Although in the future practitioners may try to avoid such ‘spikes’ in load to facilitate ‘best practice’ and ultimately avoid potential litigation, they should remember that effective rehabilitation should challenge the player to return to their highest level as quickly and safely as possible. If practitioners try to replicate generic and near ‘perfect’ loading patterns, not only will they remove the art of coaching, but rehabilitation could become ineffective and unnecessarily tedious. What science perhaps has to do now is provide practitioners with information that enables them to quantify their work to improve clinical decisions, and to push current field-based rehabilitation boundaries (in the quest of reducing reoccurring injuries) whilst maintaining the oath of doing no harm. In doing so, we should seek technologies which have a transference across rehabilitation phases (e.g. gym-based, aqua, AlterG, differing surfaces, field-based etc.). IMU Step is waterproof with an IP-68 rating, so future case studies should look to collect greater information to give an even clearer picture of the overall rehabilitation period. Additionally, researchers could compare impact loads at the tibia during gym-based plyometric progressions to those in running-based progressions. Returning to the dramatic increase in HSR during session 13, this could explain why the player did not ‘breakdown’ due to the exposure i.e. they were ‘strong’ enough to cope with it and had previous exposures (not measured) to prepare the tissues to tolerate the load. In addition to using such information longitudinally to reflect on previous and plan future rehabilitation protocols, practitioners should perhaps split and catalogue their session (Figure 10) to ascertain where work was achieved.
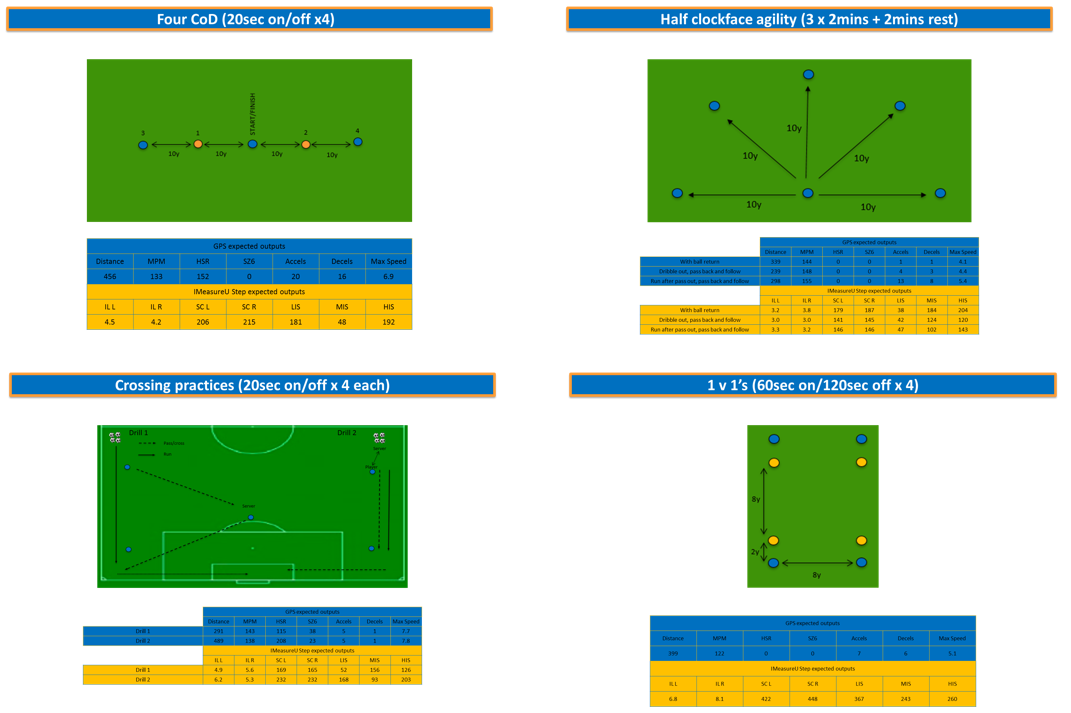
Figure 10 - Example of drill catalogue practices with expected IMU Step and GPS returns
Future work should also explore the effect of different surfaces and footwear on the metrics presented in this case study as these could alter outputs. For example, the player performed session 19 at a gymnastic centre with the aim of increasing the player’s confidence at rolling, landing and falling. TS were lower (~30%) in this session compared to those before and after, but IL was dramatically different (~90%) with HIS being even more so (~140%). This suggests that despite increases in movement complexity, impacts are lower on softer surfaces. Though we may intuitively expect these results, we can dig deeper with regards to exercise and drill selection (i.e. how factoring different surfaces into rehabilitation progressions drives adaptations). In this case study, an unplanned slip highlighted a lack of confidence in gymnastic activities, so the athlete did not perform these until the end of their field based rehab. Furthermore, the softer surface gave an opportunity to work on landings from diving volleys and headers (i.e. on crash mats) and to reintroduce sliding tackles. From here the player completed full-functional (i.e. game-matched technical/physical returns) activities with a view to return to modified (non-contact) before full-team training and then a graduated return to match exposures. Unfortunately, in the same week as scheduled RTT an international pandemic (COVID-19) cancelled the training sessions, fixtures and then the season. The player entered an initially unknown period of self-isolation and received remote support with home strength and metabolic conditioning work, static bike sessions and outdoor runs when physical distancing permitted. We intend to repeat aspects of this rehabilitation process in a microwaved fashion when normal circumstances return to ensure the player is ready to return in an integrated approach.
Mark Armitage
Mark is a Lecturer in Strength and Conditioning at the University of Suffolk and Consultant Rehab S&C Coach.
Learn more
This case study builds on concepts that we’ve explored in-depth at IMeasureU.
Follow the links below to learn more –
IMU Step: Helping to monitor chaos during rehab?
How to Improve Patient Outcomes with Objective Data
Using inertial sensors to improve the return-to-play process: A case study with Loughborough University
Have an injured athlete?
Get in touch with us and ask about a free trial of IMU Step to see how we can help your return to play.