The Virginia Tech Hokies women’s soccer team and their performance support team, like many performance support teams, are trying to find ways to maximize performance whilst minimizing injury risk.
Professor Jay Williams, Athletic Trainer Emily Whitaker, and Associate Director of Strength and Conditioning Brandon Dillard are combining global positioning system (GPS) technology and IMU Step to create a fully integrated approach to player monitoring. Establishing baseline data on all players and tracking players through rehabilitation means that each athlete is given the opportunity to maximize their potential on the field.
Maximize performance, minimize injury risk
Professor Jay Williams works closely with the women’s soccer team as part of their athlete monitoring initiative. “Our overall goal is to find a way to maximize a player’s performance but minimize their injury risk,” Jay said. “If they’re injured, they’re not contributing to the team on the field so we naturally want them to pick up as few injuries as possible. We use GPS because we are interested in external load markers such as distances and high-intensity activities. Although we were getting great data from the GPS part of the device, data gleaned from the accelerometer is a little noisier. Because of the device position at the thoracic spine, when you’re looking at impact forces when running, you’re having to infer a lot of things. It essentially sits on top of a spring. Every time the foot hits the ground we’re getting ankle, knee, hip, and trunk movements so that impact with the ground is damped when it gets to the trunk.”
Because of this and Jay’s interest in diving deeper into the accelerometer data, he and the team at Virginia Tech turned to IMU Step. Layering the data from multiple sources paints a clearer picture of where each athlete is at.
“With the IMU data we are getting a better idea of what’s happening down at the foot,” Jay explains. “With GPS we are inferring right and left foot strike patterns based on the accelerometer data. With IMU Step we are able to get that data directly. These two technologies can work together nicely. GPS is giving us the speed data and helps us understand how gait varies as running speeds change. GPS also gives us an idea of trunk rotations from the gyroscope. That data is really interesting because it may be linked to stress being placed on the hips and knees and therefore injury risk and even occurrence. They are very complementary data sets.”
Establishing benchmark data with IMU’s
Jay and the rest of the performance team wanted to accumulate benchmark data for each player. This not only helps during the return to play process should an injury occur, but it can also be used to monitor acute and chronic fluctuations which can flag negative adaptations to training.
“Fatigue can contribute to the risk of injury so we want to monitor that fatigue on a day-to-day basis,” Jay explains. “College soccer games are often played on a Thursday evening and a Sunday afternoon so you can imagine how much stress that puts on these athletes. They run about 10-11km per match so it’s important to look at how they are responding to that. We see some really interesting changes between the Wednesday before the first match and Monday after the second match. That’s not surprising but it allows the coaching staff to modify training based on objective data should we feel it necessary in the days following that congested calendar.”
“The other benefit of collecting the preliminary data is to have an idea what a player’s normal is. These data can then be used in the return to play process following injury. For example, we had a player a few years ago who had a natural asymmetry of about 5%. She injured her ankle so was naturally limited with the activity she was able to do. However, when she was able to run, we saw that the asymmetry had reduced to almost symmetrical. We knew then that there was a negative change. Had we not had the preliminary data we would have looked post-injury and thought her gait was symmetrical and would have been pretty pleased. As we progressed through the rehab knowing that changes had occurred, that natural asymmetry re-emerged. So it’s important to know where they are at the beginning before we can assess where they are at any point in their rehab.”
To be able to collect data to form benchmarks, Jay and Brandon Dillard introduced a standardized run at the start of each day as part of the players’ warm-up. This standardized run with the IMU Step sensors has enabled the team to ask better questions.
“The coaches have really bought into this process of incorporating a standardized run into the warm-up. Right after their sport-specific warm-up, they go on a 200m jog at a self-selected pace up and down the field. It’s through this standardized run that we are able to extract the majority of the baseline data. If we were trying to collect this data from training drills, it would be so much more difficult due to day-to-day variation in effort, intensity, etc. If we do see fluctuations in the data from a standardized activity, it allows us to ask better questions. Why has their gait changed? Is it fatigue, is it an injury, is it a lack of sleep? These athletes have a lot going on in their lives so there are many reasons why there may have been a change. Once we have the data, Brandon can adjust training to better meet the needs of each athlete.
Guiding rehab using Impact Load an asymmetry data
Jay concentrates on two main metrics, Total Impact Load and Impact Asymmetry. However, deeper dives into the raw data are allowing him to glean much more granular metrics such as ground contact time, step time, and stride time.
“Total impact load is the metric I am most concerned about when athletes are going through rehabilitation. If we know what they do on a day-to-day basis when they’re fit, we can periodize that recovery, gradually building them up. When looking at the day-to-day monitoring through the standardized warm-up, I am more concerned about the asymmetry scores to see if they have deviated from where they were before.”
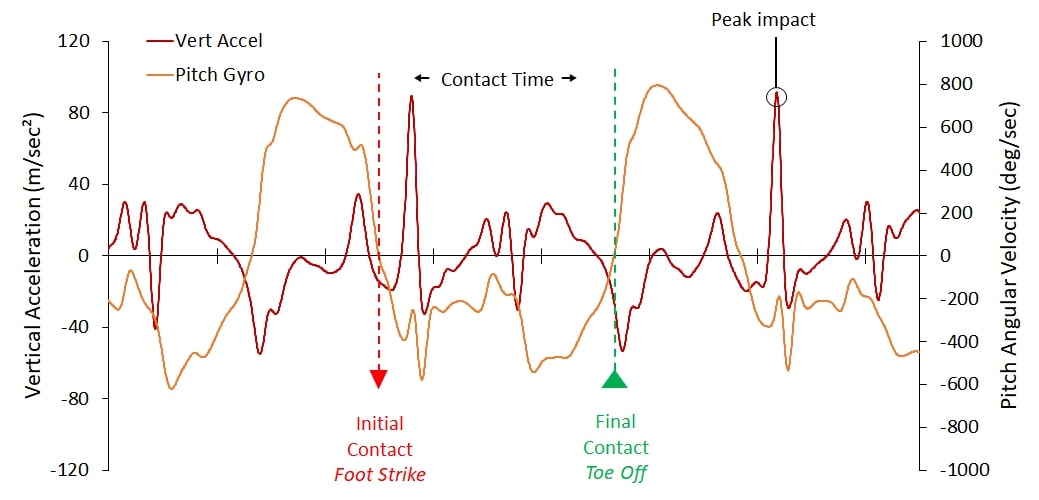
Figure 1: Gait deep dive
“We’re also starting a project where we dive deeper into the raw data (figure 1) and look at the ground contact time, step time, stride time, etc. Just looking at some preliminary data we can see some really interesting changes which are occurring in ground contact time pre and post-injury. We are also looking a little deeper into the raw gyroscope data and gait patterns. You can see in the graph above the kind of information we are getting. A lot of companies won’t give you access to the raw data but IMeasureU and StatSports do. So as a researcher, I can really dive into that.”
Using the Data With an ACL Injury
Unfortunately, injuries happen in sport. In mid-October, a member of the soccer team sustained an ACL rupture. However, because Jay had baseline data on this athlete, he is now able to monitor and plan her return to play program with the use of IMU Step.
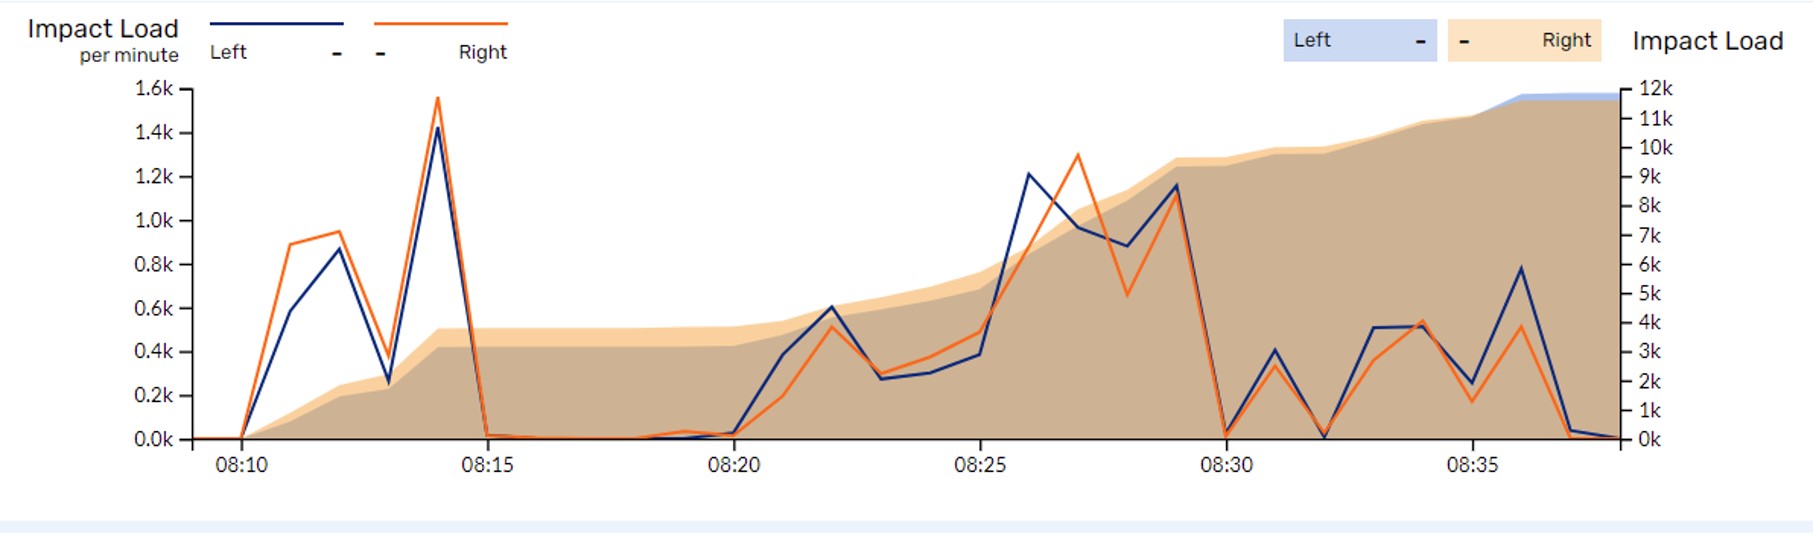
Figure 2: Asymmetry data on the day of injury
“The data we are looking at here (figure 2) is actually the day she was injured. The data collected just before 8:15 am is the standardized run which is so critical to this process. The accumulation of load through the session is pretty similar when looking at left and right limbs. And she has a fairly symmetrical running pattern”
“In the next graph (figure 3) we can see that there is a little more load going through the left leg at lower speeds and a little more on the right as she picked up her speed a little. But overall she had a 3.35% asymmetry to her right side.”
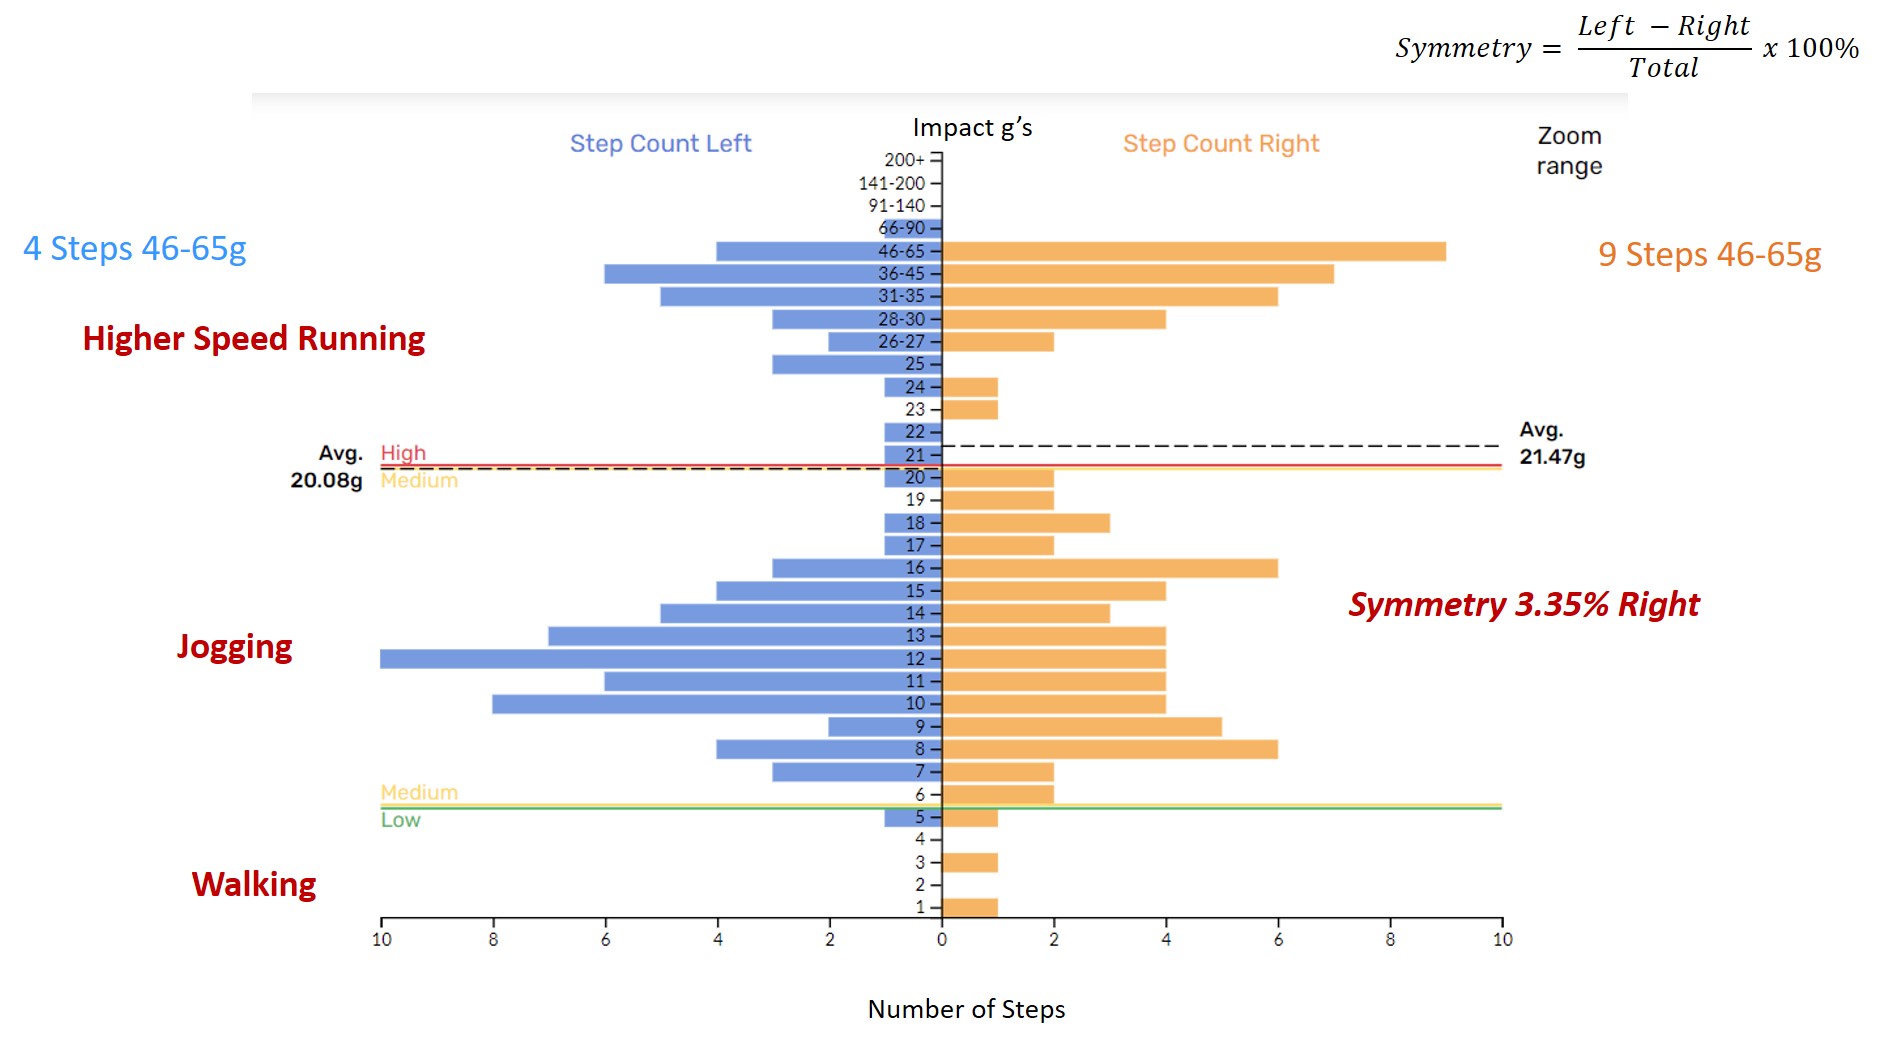
Figure 3: Impact distributions on the day of injury
“But this next graph (figure 4) is data collected during her third running session back post-surgery. It was a right leg injury and as you can see, the left leg is taking much more load than the right. Also, the accumulated load graph is beginning to separate. She is showing an asymmetry of about 11% to the left.”
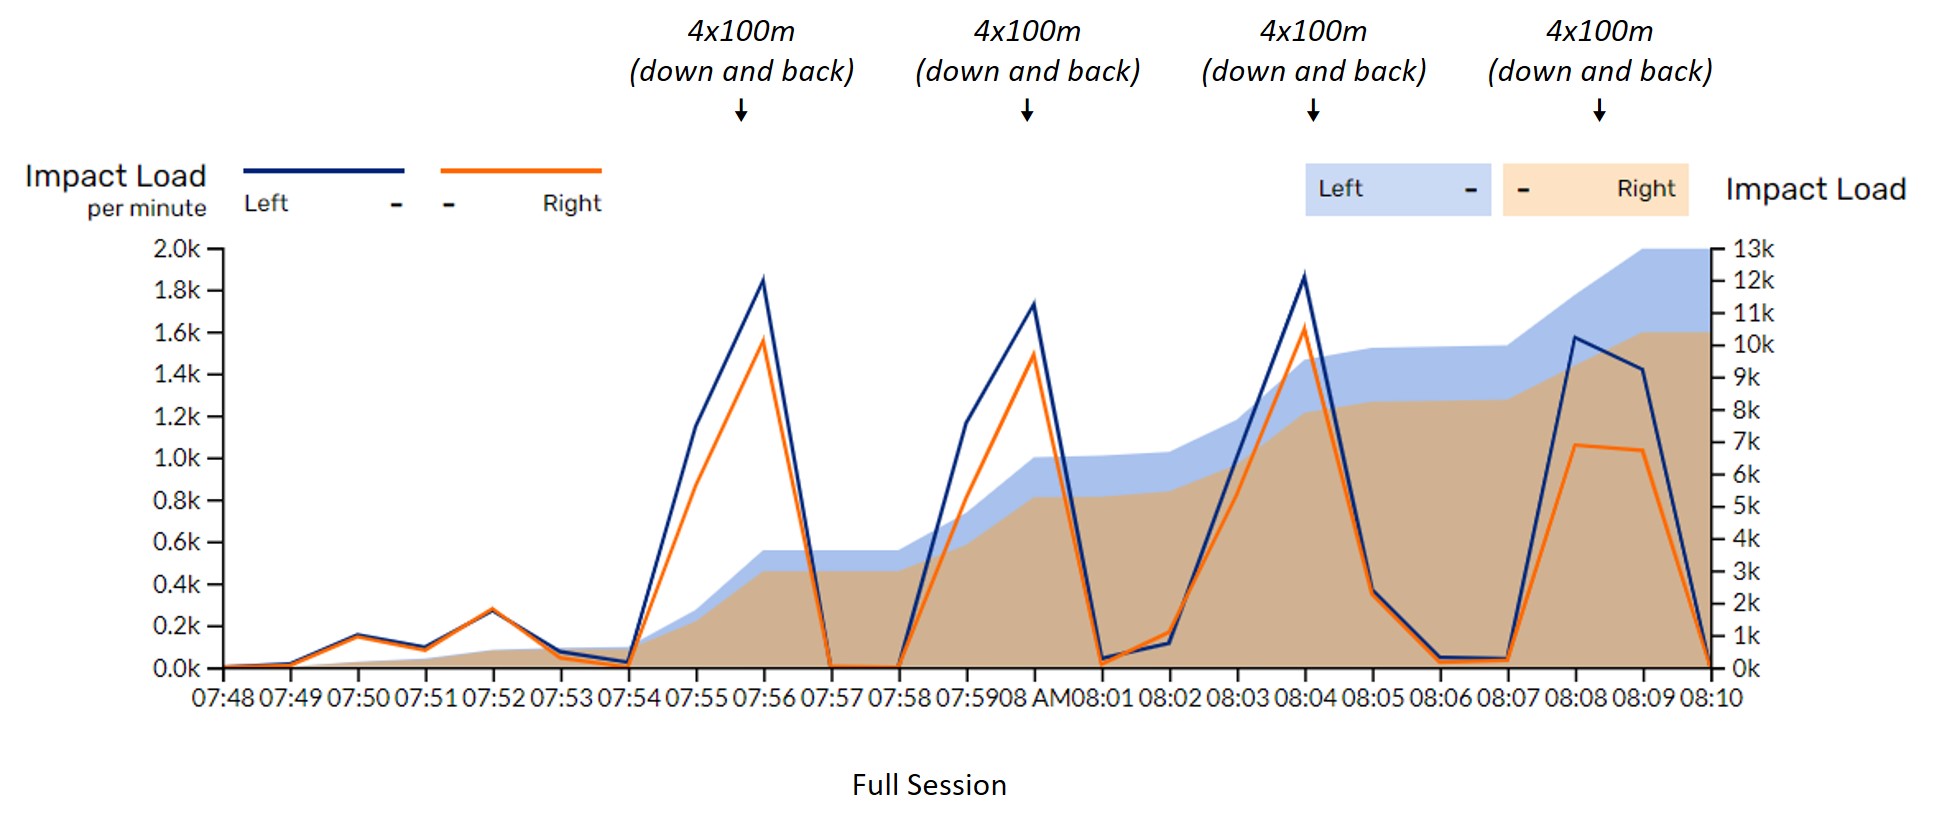
Figure 4: Impact Load per minute and Impact Load, 18 weeks post-surgery
“This is not unexpected, however. She had been doing a little bit of running on the Alter-G before this session took place but this was one of the first at 100% body weight. As you can see in the next Christmas tree graph (figure 5), the blue bars have been pushed up significantly showing that the healthy leg experiences higher loads, particularly at higher speeds.”
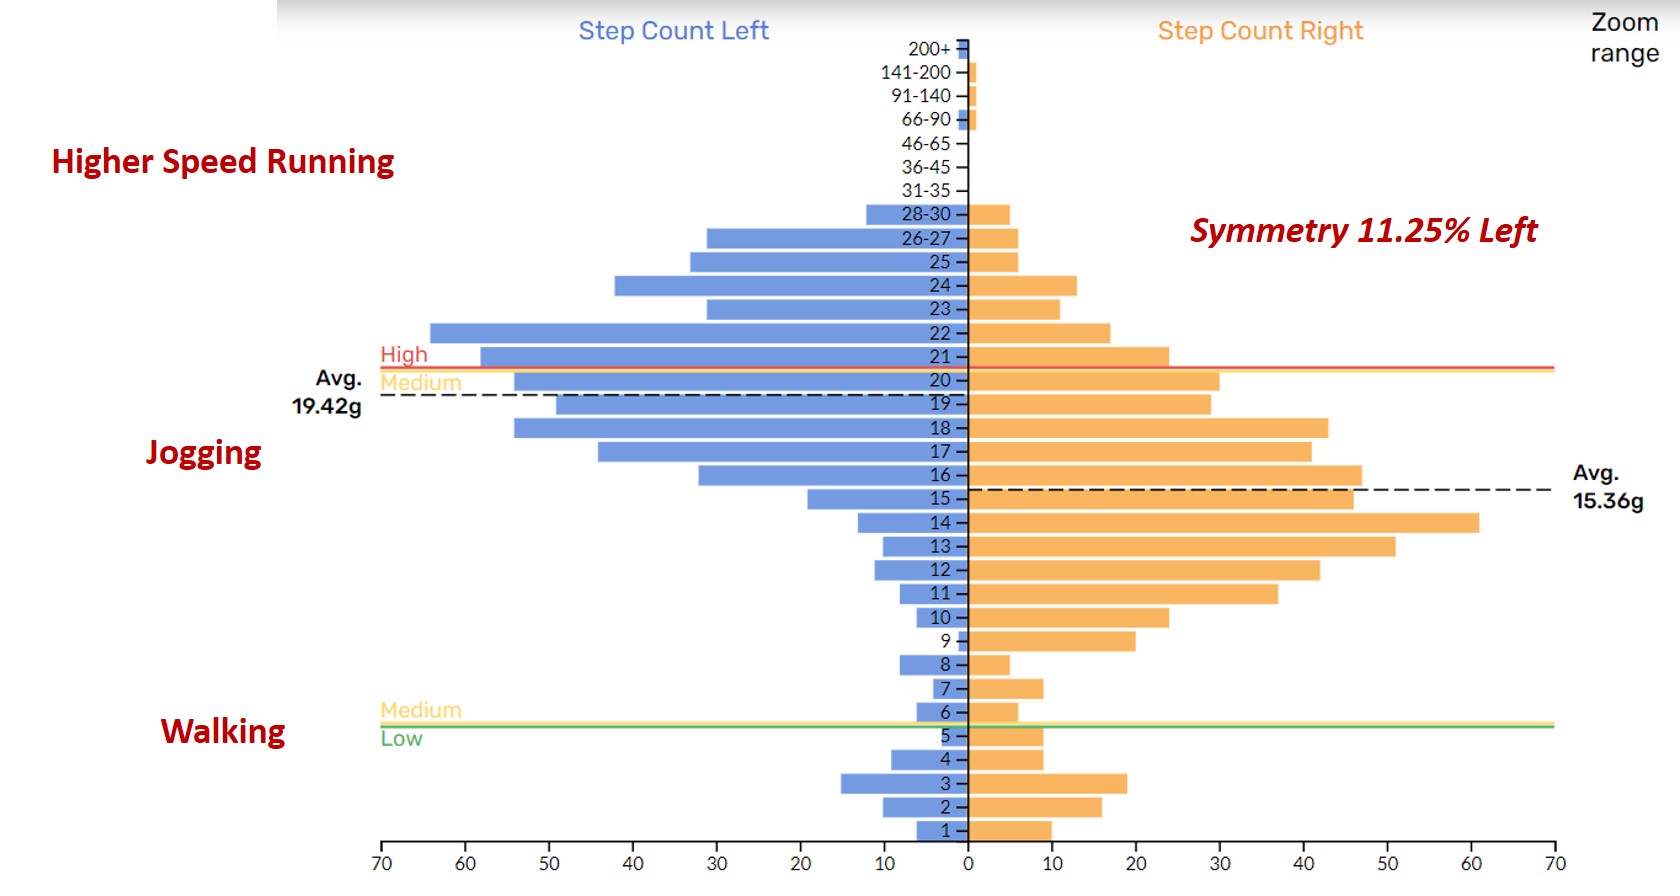
Figure 5: Asymmetry data, 18 weeks post-surgery
“This next graph (figure 6) shows some progression in the speed that she was running at. This graph clearly shows a relatively large asymmetry of around 19% with the load accumulation graph separating a lot.”
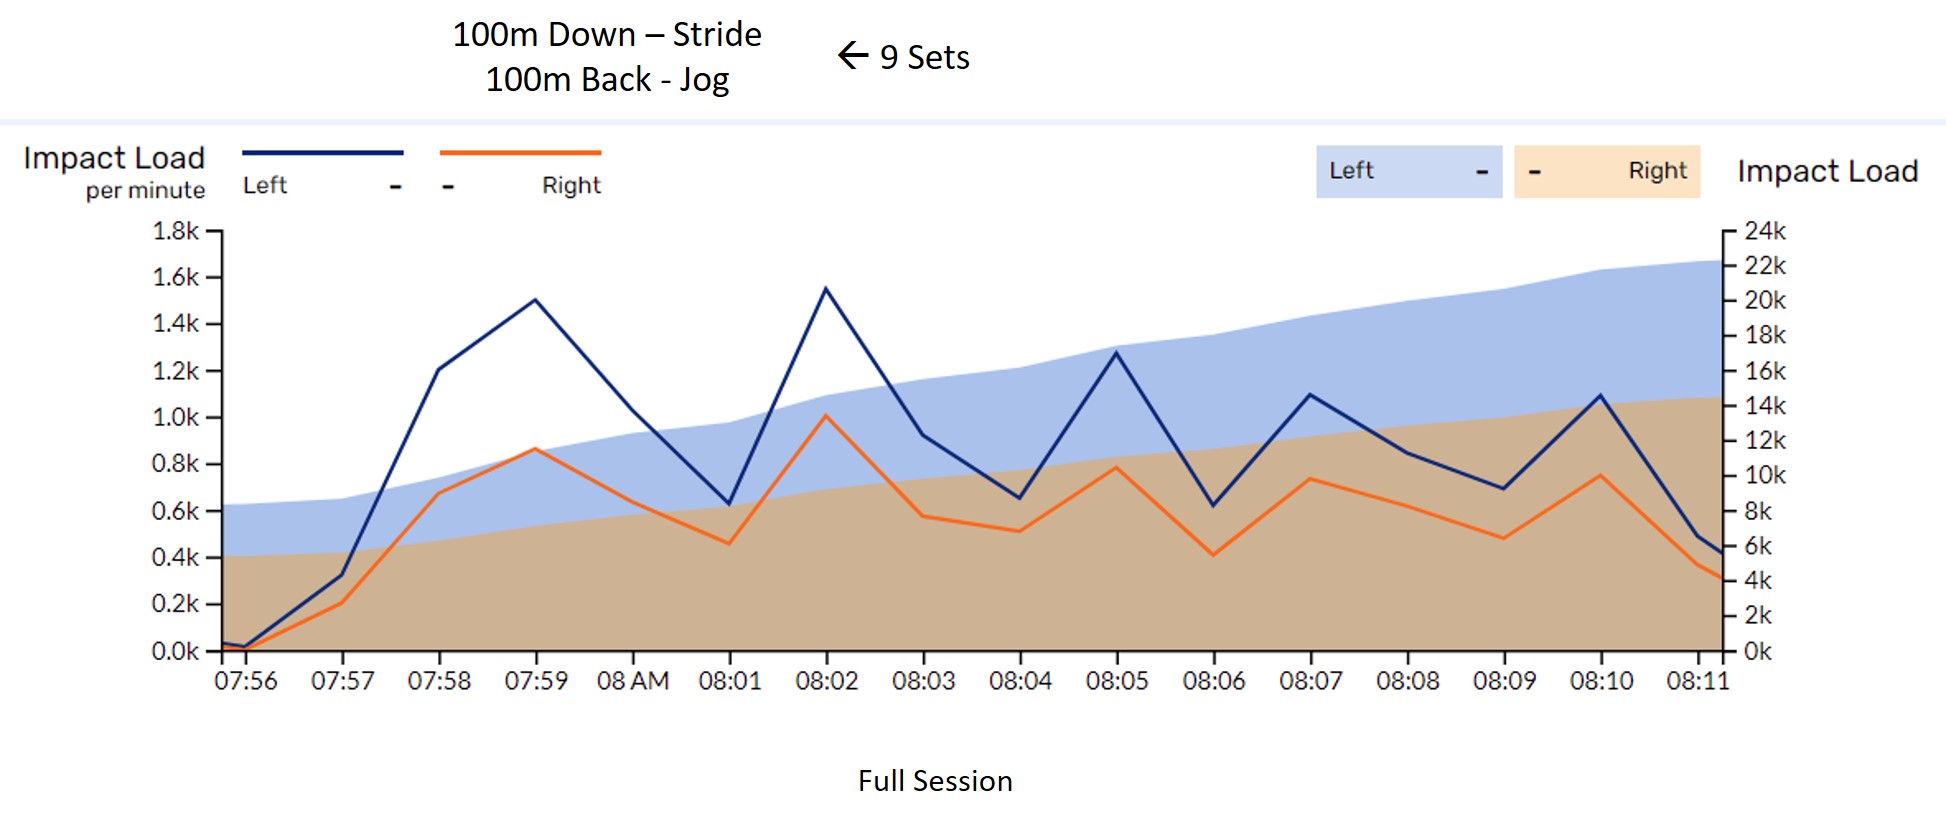
Figure 6: Impact load per minute and Impact Load, 18 weeks post-surgery
“The next graph (figure 7) shows that Christmas tree graph again showing that clear distribution between higher speed running and jogging. Clearly, at the higher speeds, there is a greater asymmetry towards the left leg. This data is what we expected at this stage of the rehab.”
“Brandon has also used the raw data to confirm what he’s seeing as the athlete runs. Abnormal hip and knee rotations can be clearly seen in the raw data. With that, he can work with the athlete to confidently make the necessary adjustments as she continues through her rehab program.”
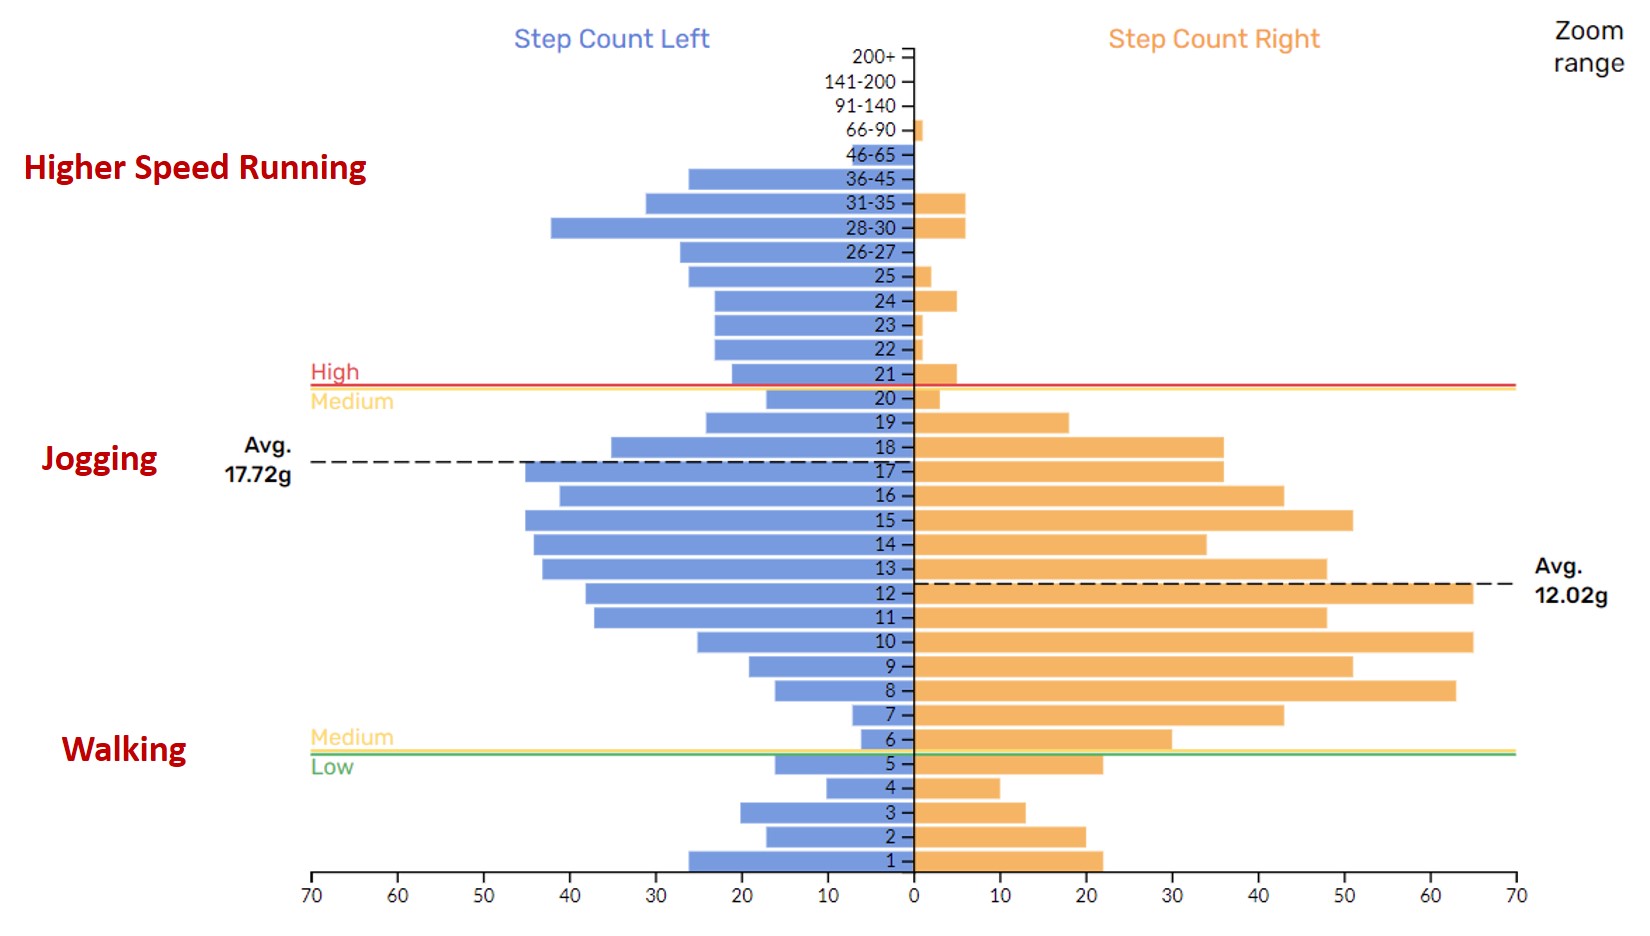
Figure 7: Asymmetry data, 18 weeks post-surgery
Graduate Assistant Athletic Trainer, Emily Whitaker has played an important role in implementing this data on a daily basis. Using this data and the guidance from Brandon and Professor Williams, she has been able to get this athlete to the 5-month mark in a great position.
“This athlete is now at the 5-month mark,” Emily explained. It has been great to have access to her pre-injury data and that data has helped us plan her return to play running progressions. We are observing her on a daily basis, looking to see if she is bringing her injured knee into flexion as much as her non-injured knee, running with a limb, or compensating in any way. But to have the data to confirm what we are seeing has been so helpful. The objective data has allowed us to guide her progression, especially when we have been concerned about whether we are doing enough or too much. As we move through her progressions, we have wanted to ensure that we are getting into those higher impact zones and IMU Step has helped us ensure that we are.”
“Just looking at her run you would think that she is pretty symmetrical. However, looking at the data that Jay has presented, you can see that at higher running speeds, asymmetries are still present. To try and address that we want to increase the strength in her injured leg as she is still 2cm down in girth compared to her non-injured leg. Complimenting this will be some work on increasing her explosivity in an attempt to even that asymmetry out. We do have a protocol that we work from here at Virginia Tech and this data has supported that protocol really well.”
Despite only having access to IMU Step for 9 months, Emily and the sports medicine team already have plans to increase their use of the data in the future.
“In the future, we would be looking to use this data in a preventative way as well as during return to play,” Emily said. “We plan to increase the use of IMU Step during pre-season when the load is very high to effectively manage that time period. We also want to increase the depth of baseline data that we have to better inform the return to play protocols should an injury happen.”
A Comprehensive Approach
At Virginia Tech, Jay, Emily, and Brandon work closely with the coaching staff to provide a comprehensive approach to athlete monitoring, training, and rehabilitation. “It’s the collaboration of research, clinical assessment, and coaching that are at the heart of our success. We really strive to blend our specialties when working with the athletes. As a researcher, I need input from the coaches and clinicians to help make sense of the data we are collecting and understand how it can be applied on the field. In the end, it’s all about the players, helping them reach their potential while keeping each one healthy and injury-free.”
Learn more
This case study builds on concepts we’ve explored in-depth at IMeasureU. Follow the links below to learn more –
Practical Examples of Using IMU-Step to Modify Outcomes: Asymmetry and Impact Load in the Real World – a webinar with Andrew Gray
Understanding External Biomechanical Load During ACLR Rehabilitation – A webinar with Mark Armitage
Managing the Mental Side of Injury During Quarantine
Have an injured athlete? Get in touch with us and ask about a free demo of IMU Step to see how we can help your return to play.