The Use of Inertial Measurement Units in Track and Field
By Michael Giakoumis. Physiotherapist and Lead of Medical Research and Innovation at British Athletics
Objectivity is the enemy of bias. As team sports continue to advance in their ability and endeavor to measure every meter ran and every twist and turn, track and field has stayed with the foundations of coaching; assessing movement with the use of the eyes. However, this leaves room for personal bias. In the current world of trying to be as objective as possible, track and field has room to grow in its journey of embracing technology.
For some, numbers and objective measures can cloud their judgments, but for many the use of objectivity helps to inform and quality check their decision-making, mitigating confirmation bias.
Where the art of objectivity comes in is the interpretation of data, not in obtaining the data itself. I often liken it to painting a picture. Data is simply the background or canvas. What brings it to life is the context, background and interpretation that the support staff can provide.
In any sport we, the support staff, are servants to the athlete and coach. In my opinion our job is to help provide fit and healthy athletes that are capable of performing the training given by each individual coach. In the world of track and field monitoring high speed meters and distances are irrelevant. Our individuals need to be pushed physically to their limits to obtain the goal of Olympic glory. So the question that we often ask ourselves is, ‘how can we support this athlete so they can do what is asked of them’. In our world there is no line between injury prevention and performance, the two must blend for it to matter and be beneficial. Hence profiling/screening at an in-depth individual level is important to identify along with the coach areas of improvement.
“I encourage those that have the ability to trial the IMeasureU units to do so. As with everything you need to have your ‘why’ in order to get the most out of it. We did and it was able to help us answer our questions.”
Historically physiotherapists profile and screen on the bed, and S&C coaches profile in the gym, but how do we bridge the gap to the track? How can we assess kinetics in their environment? We hence decided to trial inertial measurement units from IMeasureU to help inform us on how an athlete loads their body.
As we run and impact the ground, a shock wave travels through our skeletal system. Individual anatomical structures both passive (bone/cartilage) and active (muscles) attenuate the shock wave as it passes through. As we increase the intensity, we increase the magnitude of stress. What IMU’s do is measure the ‘rate of loading’; this is not the same as ground reaction force and does not have a strong correlation to it (Raper et al., 2018). What this means is that the faster you hit the ground and the faster you slow down, the higher the rate of change/loading occurs (rate of change in velocity). Hence it measures acceleration and presents it as ‘g’, which is gravity (gravity = 9.81m/s/s). So even just standing, 1g is acting on us as we are constantly under the influence of gravity.
Below is our case study on Laviai Nielsen, an elite 400m athlete and how we utilized the IMU Step data.
The key areas that we wanted to investigate were:
- What is this athlete’s natural loading pattern?
- How much ‘load’ does she undergo in a week?
- What happens to her loading rate around a bend?

We monitored Laviai with the IMU Step sensors for 4 consecutive training sessions. Below are the results from a single session, data from four consecutive sessions (filtered and unfiltered) and the raw data from a segment of a maximal 300m run.
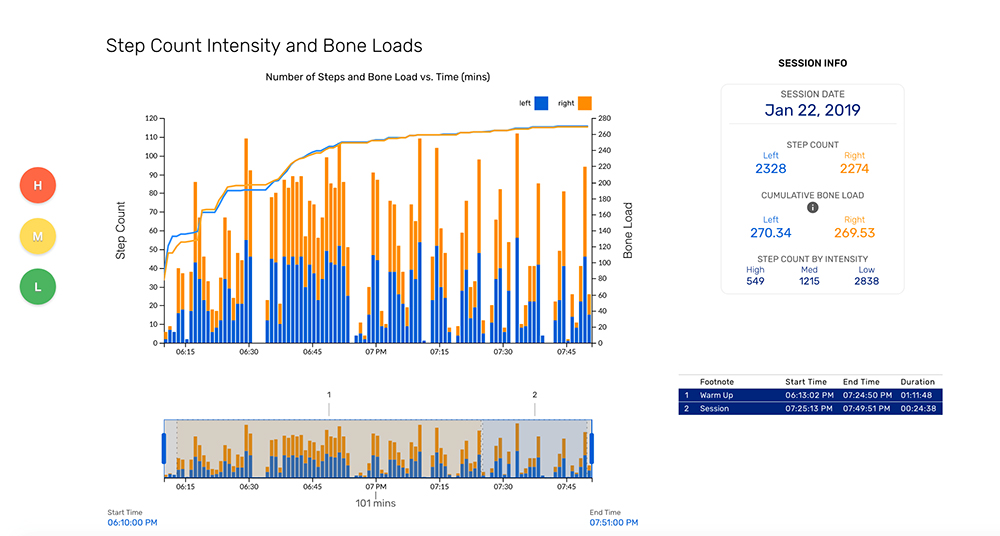
Figure 1. Summary results from a single training session
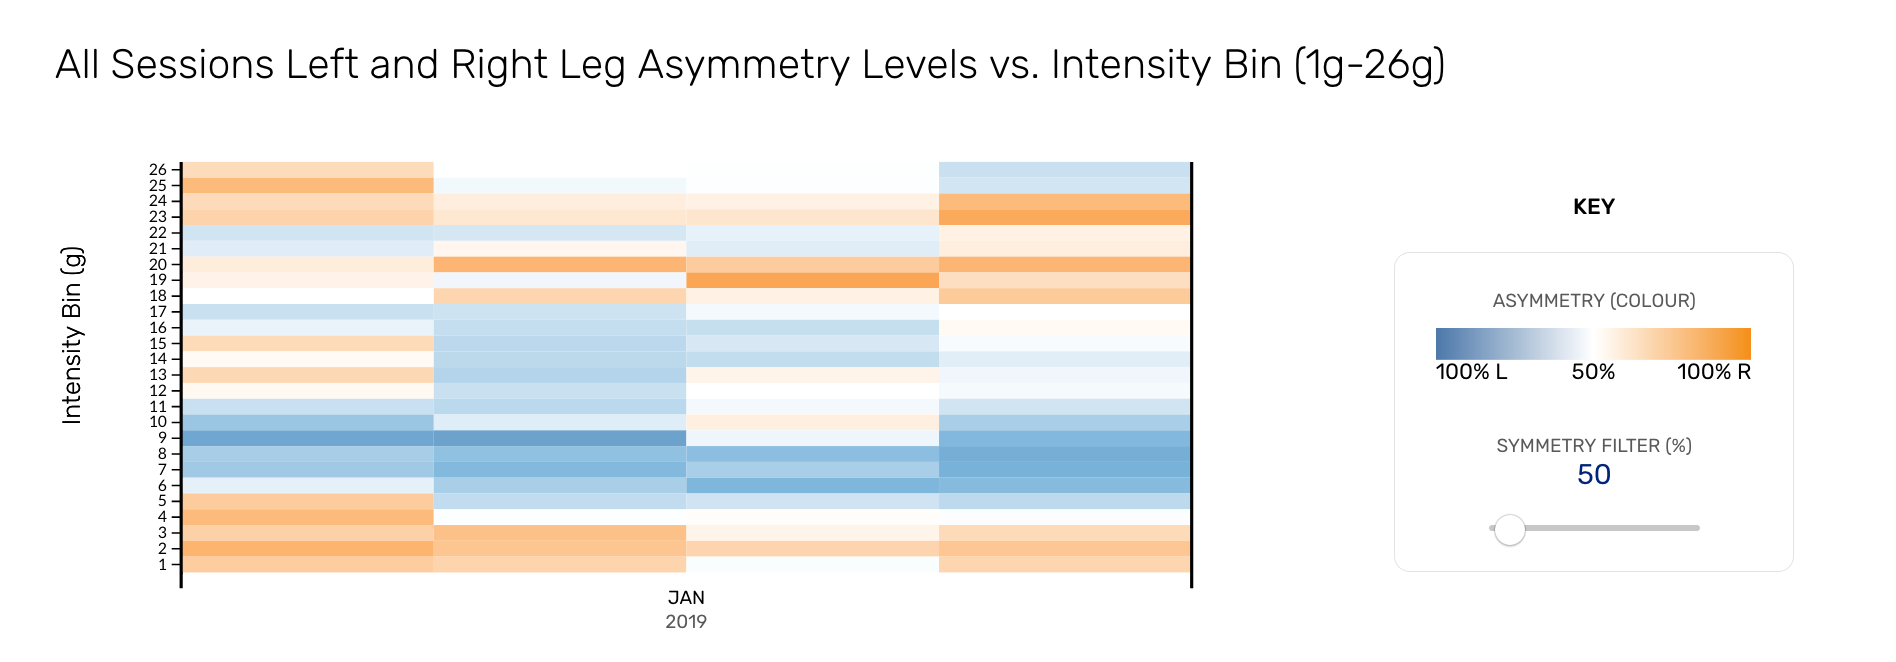
Figure 2. The load profile of the athlete across four sessions
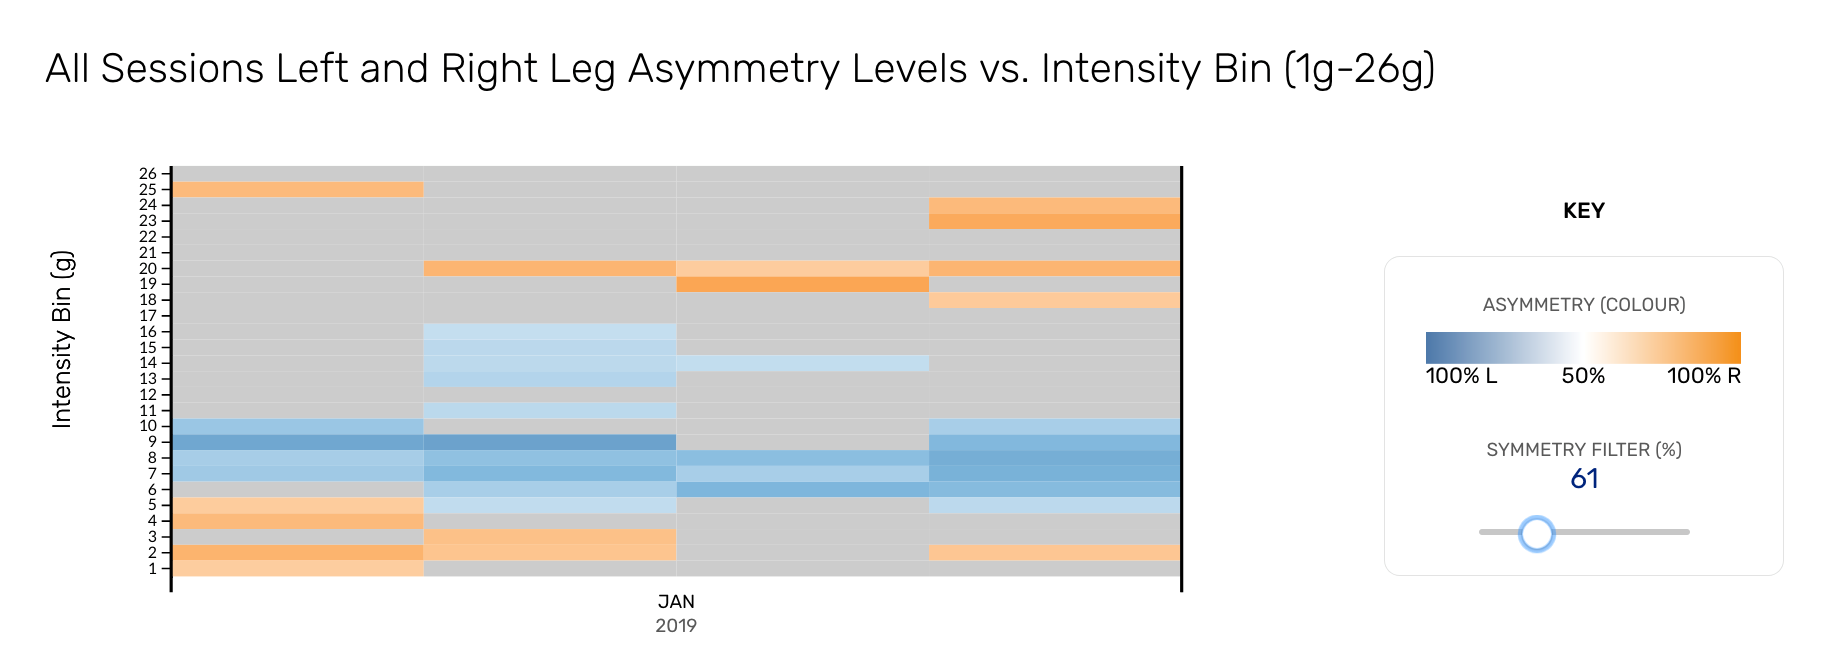
Figure 3. The athletes load profile across four sessions filtered to only show asymmetry above 60%
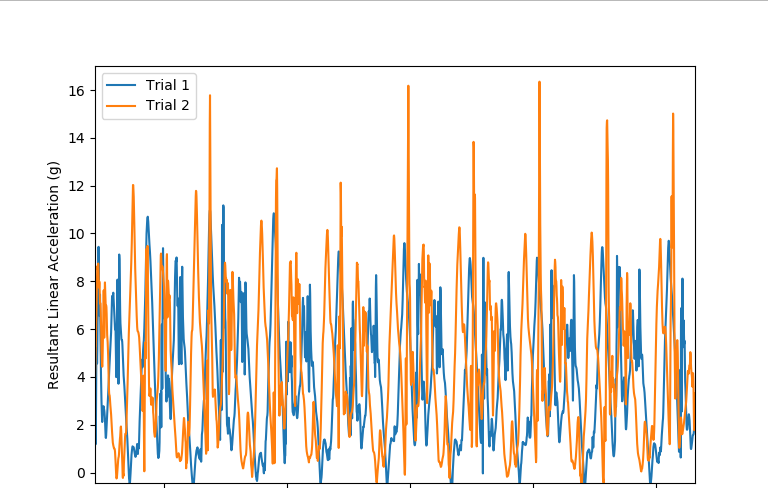
Figure 4. Raw accelerometer data from a segment of a maximal 300m run.
Some notes on Laviai’s background:
- Coach has consistently said her left side is less ‘stiff’ when she hits the ground
- She has a recurrent history of tibial periostitis (shin splints) on her left side
- Tibial varum with tibial torsion in her left leg
- Increased range of subtalar eversion on passive joint testing on the left ankle
In relation to what we saw from our data, it confirms the coach’s eye in seeing that there is less ‘stiffness’ at higher intensities on the left. This is shown by both the asymmetry to the right at higher accelerations (figure 3) and the reduced peaks on the left from the raw data (figure 4). If we think about performance and that the coach wants more global stiffness, this then helps us to identify that somewhere between the unit and the ground there is a leakage. From combining the key points above, this likely comes from the increased range of of subtalar eversion and the inability to decelerate and control this.
Furthermore at lower intensities, the left hand side seems to have a greater rate of change in velocity, which may be more related to an inability to attenuate the forces travelling up and hence the rate of change for that intensity is higher than it needs to be. This is observed by the consistent concentrated region of blue in figure 3 that shows an asymmetry favoring the left in medium intensity activity. This potentially increases the demand on the passive structures and may explain the recurrent tibial periostitis.
The hypothesis is that there is an inability to control and decelerate the increased range of subtalar eversion and hence more time for movement to occur, leading to less acceleration (acceleration = change in velocity/time).
In order to confirm or deny the above hypothesis, further steps would be required. A few weeks following the completion of indoor season, we videoed the athlete performing running drills and also measured her isometric peak plantar flexion scores. After recording the athlete during running, rather than the unstable subtalar joint being the cause of her problems, it was instead a symptom.
As observed in the images below, you can see just prior to contact (figure 5), the athlete is already in pronation which then causes further pronation during the ground contact phase (figure 6), increasing the strain on the medial structures of the ankle complex. In conjunction, the athlete produced isometric peak plantar flexion scores of 2.8 and 2.9xBW on the left and right respectively. The question is ‘what does this really mean and what can we do about it?’
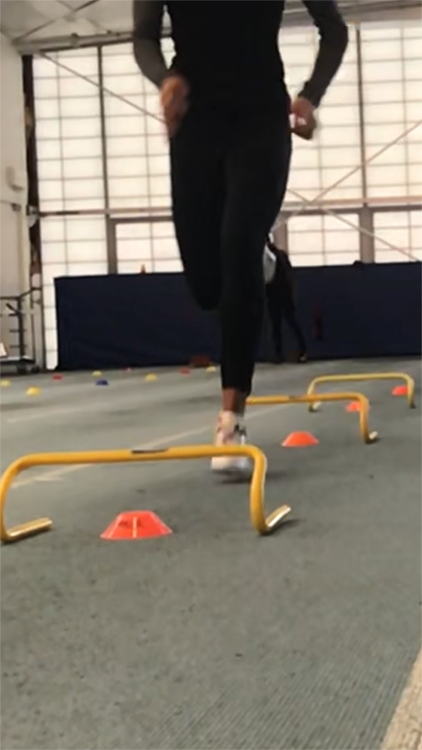
Figure 5. Pronation prior to ground contact
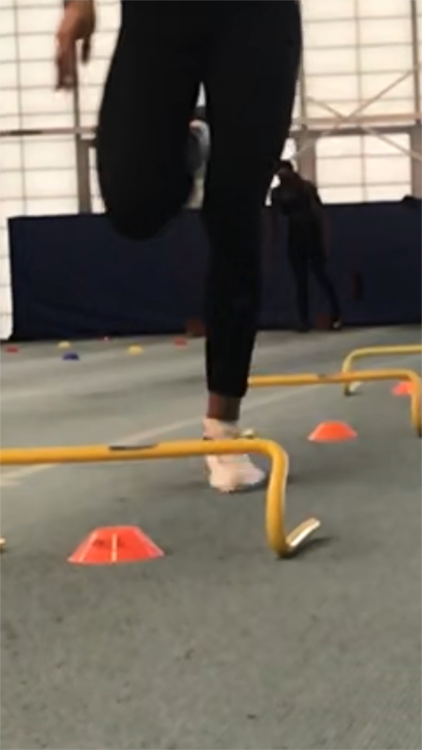
Figure 6. Pronation during ground contact
It was important to discuss what we saw in the data with the coach and athlete. Maybe in a team sport, running and movement patterning may be our role, but in our world of athletics the coach is the one with the expertise. In the meantime we needed to support how the athlete currently moves physically. Knowing that peak plantar flexion incorporates the medial musculature and calf complex in its strength outcome, these muscles help to control the rate and level of pronation and ensuring high levels of strength is important. Despite providing good scores of PPF, the benchmark is 3.5xBW as a female Olympic level athlete in case study data. Furthermore I would want the asymmetry to be the other way around where her left is stronger than her right.
Tooled with the whole picture, we have been able to provide a program to improve the strength of the ankle plantar flexors and the coach continues to work and monitor the progression in the patterning of the foot strike. In the future IMU could then be utilized again to re-assess her progress in an objective way.
Overall, IMeasureU have been able to build a user-friendly system that’s practical, easy to use and portable. For me the system is able to provide more depth to profiling and the individual analysis of an athlete. Like anything it’s able to add extra pieces to the puzzle. It has the ability to be used as an objective monitoring tool both pre, post and during any intervention. As their software and hardware continue to grow there is definitely avenues for it to provide quicker in-depth analysis and load monitoring that offers something different compared to GPS. The additional benefit as observed is that over a period of time by adjusting the symmetry marker between figure 3 and 4, you can get a good and quick picture of the pattern of loading at different intensities.
IMeasureU can do a lot more than what is presented in our case and our approach may be unique. Hence, I encourage those that have the ability to trial the IMeasureU units to do so. As with everything you need to have your ‘why’ in order to get the most out of it. We did and it was able to help us answer our questions.
References
Raper, D.P., Witchalls, J., Philips, E.J., Knight, E., Drew, M.K., Waddington, G., 2018. Use of a tibial accelerometer to measure ground reaction force in running: A reliability and validity comparison with force plates. J. Sci. Med. Sport 21, 84–88. https://doi.org/10.1016/j.jsams.2017.06.010