Narrowly missing out on a national Championship in 2019, Texas Tech men’s basketball is one of the most recognizable teams in the Big 12 Conference and the NCAA. In a bid to stay at the cutting edge of athlete preparation, the basketball staff has integrated their data analysis with the Human Performance and Biomechanics Laboratory at the university.
Dr. John Harry, Director of the Human Performance & Biomechanics Laboratory, and Graduate Assistant Sports Scientist, Jacob Hurwitz, have been using their expertise in and out of the lab to answer specific questions posed by the coaches who work directly with the men’s and women’s teams, paying particular attention to increasing player availability and returning athletes after injury.
“Coaches often intuitively know that certain drills are harder than others, which guides the periodization of the week leading up to games. But we didn’t have objective numbers to back that up. This question led us to really dig deep on which specific components of workload we care about”
Bridging the gap from science to practice
“A number of years ago I reached out to John Reilly, head strength and conditioning coach for the men’s basketball program because we wanted to bridge the gap between the lab and the team, the science and the practice”, Dr. Harry explains.
“We explained the services we offer to the strength and conditioning coaches and asked if there were any questions they wanted to answer from a player’s health, performance, and resiliency perspective. Three areas they thought we could offer assistance with were pre-practice screening, performance assessments, and reducing injuries.”
Before diving straight into answering these critical questions, it was essential for Dr. Harry and his team to audit what kind of data was currently being collected at the university.
“Before we started working closely with the team, they were using a certain technology to try answering the questions mentioned. However, they weren’t sure of the efficacy of the data that the technology was generating.”
“At the outset, it was essential for us to run a number of pilot studies as proof of concept. As part of the proof of concept, we brought in IMeasureU to help us get an idea of what stimulus we were exposing the athletes to during practice and how that compares to games. We wanted to understand if they were being adequately prepared.”
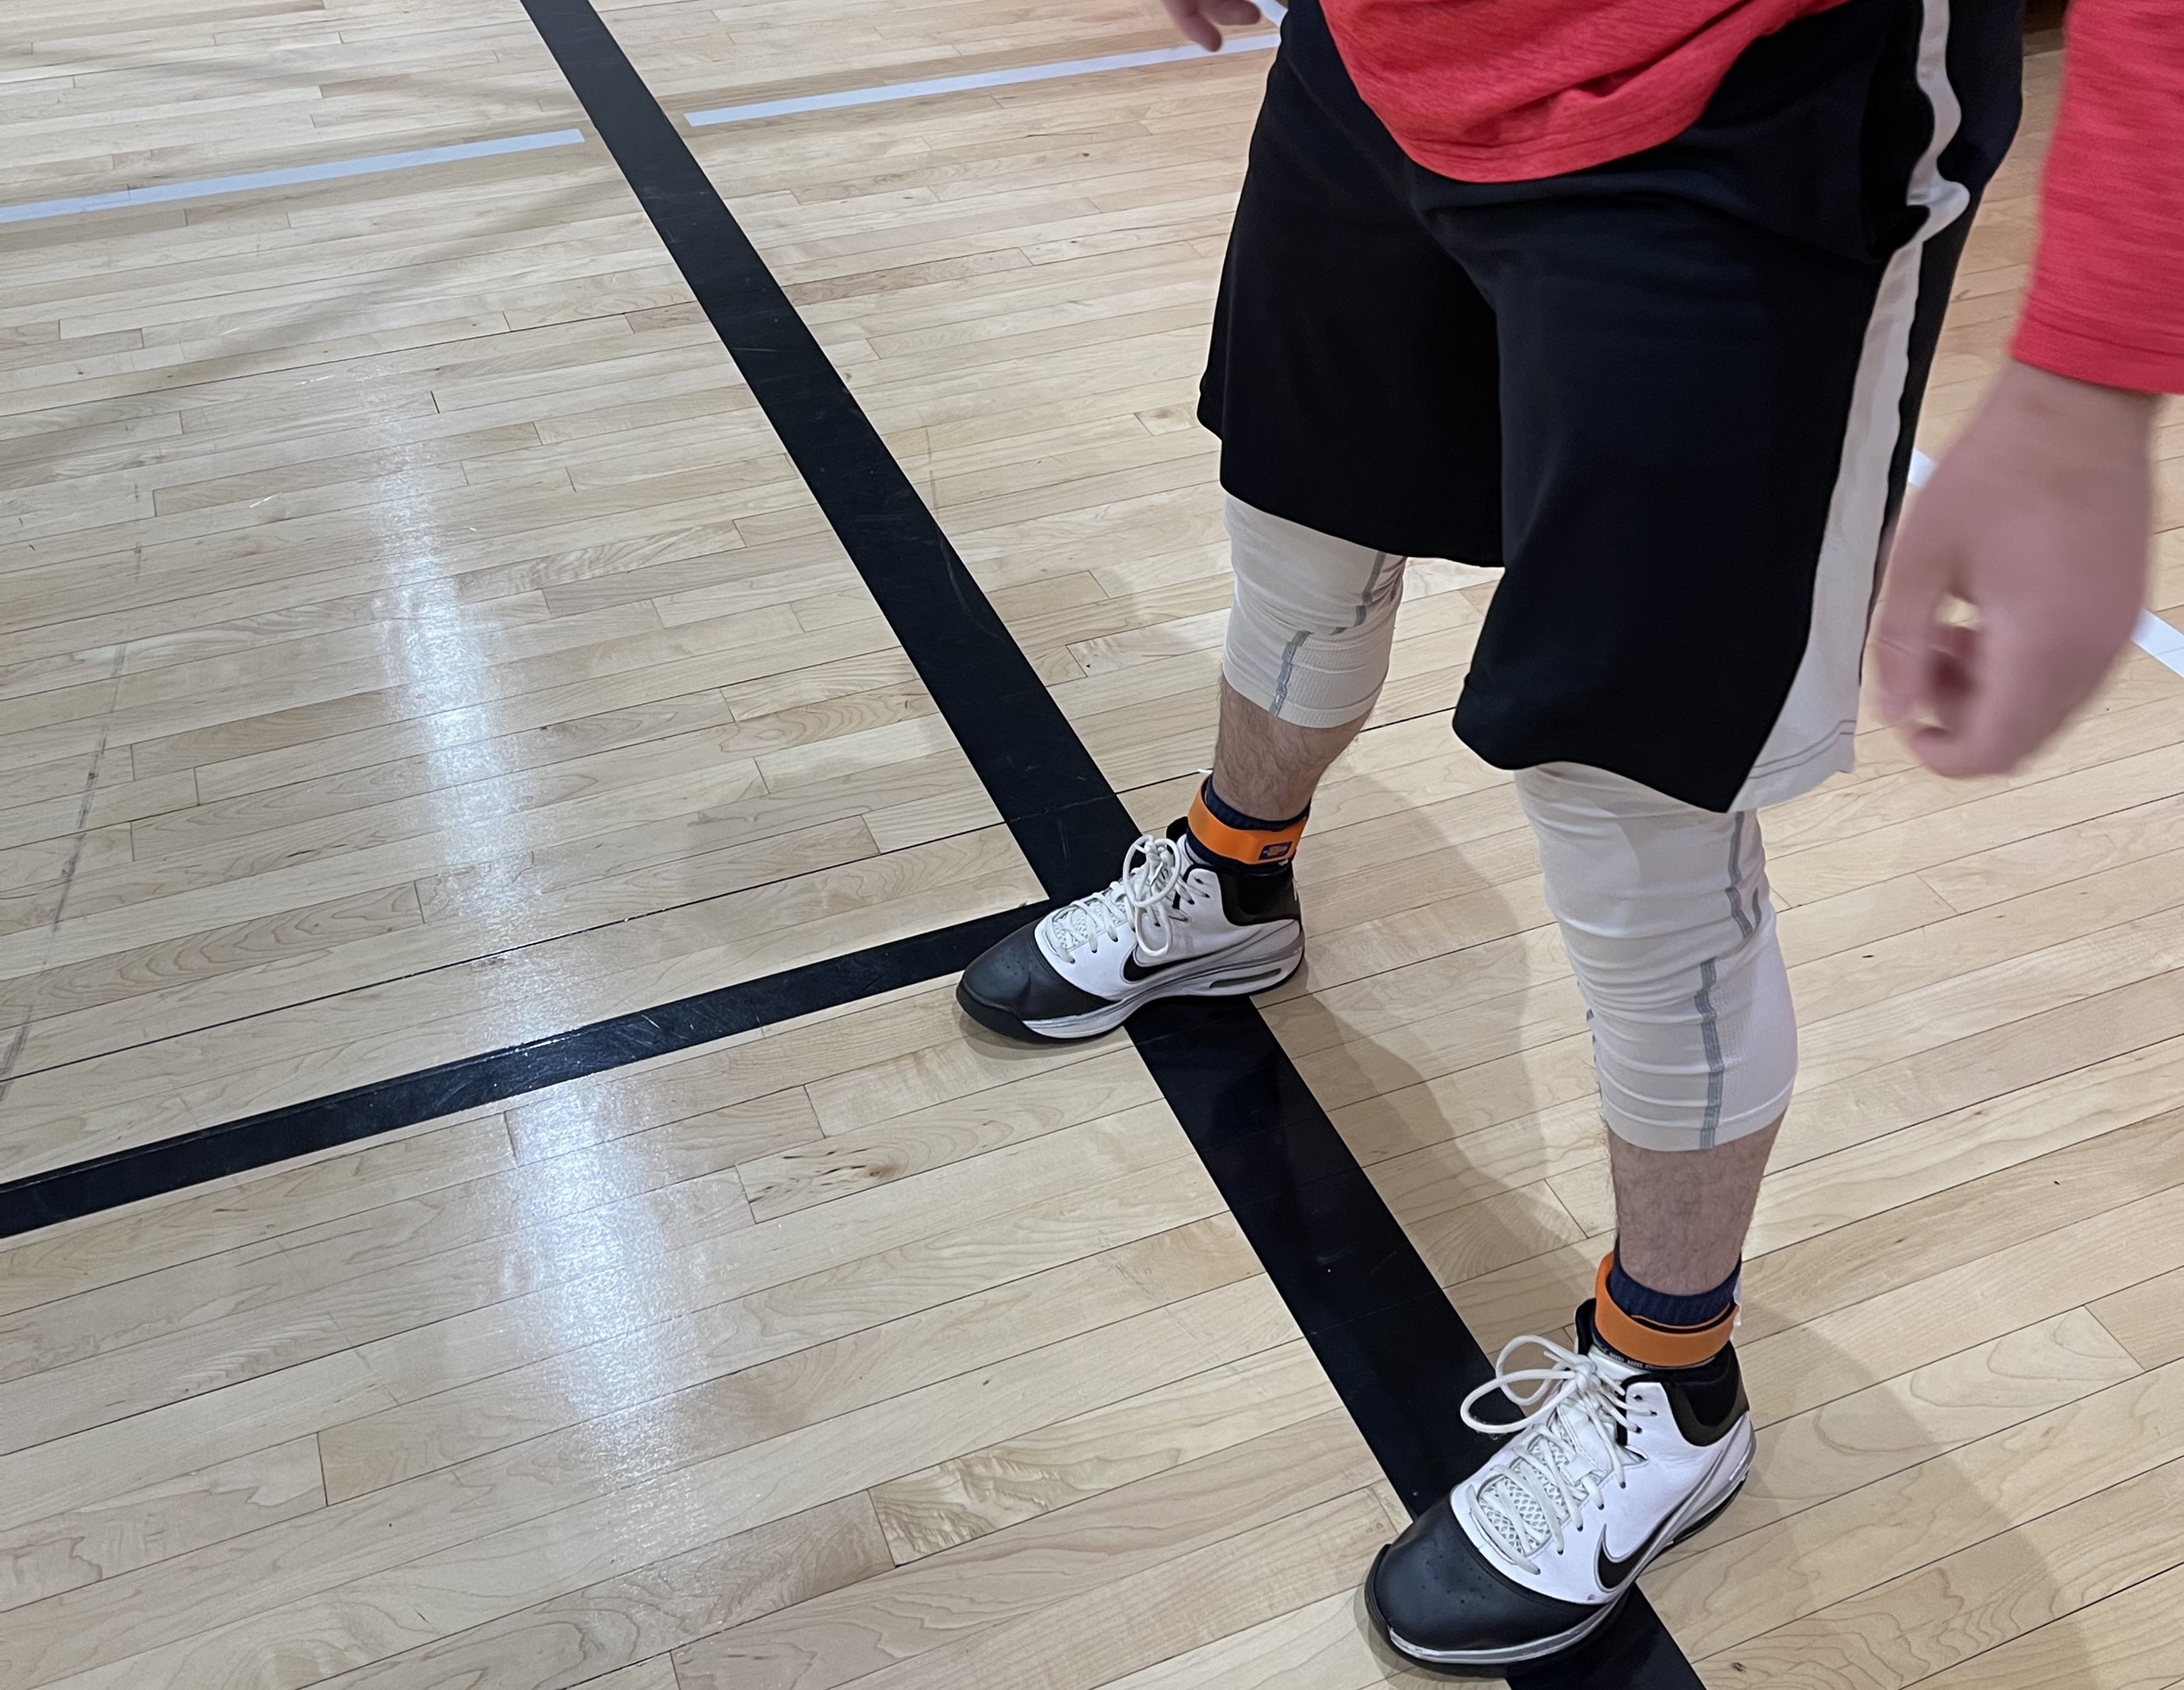
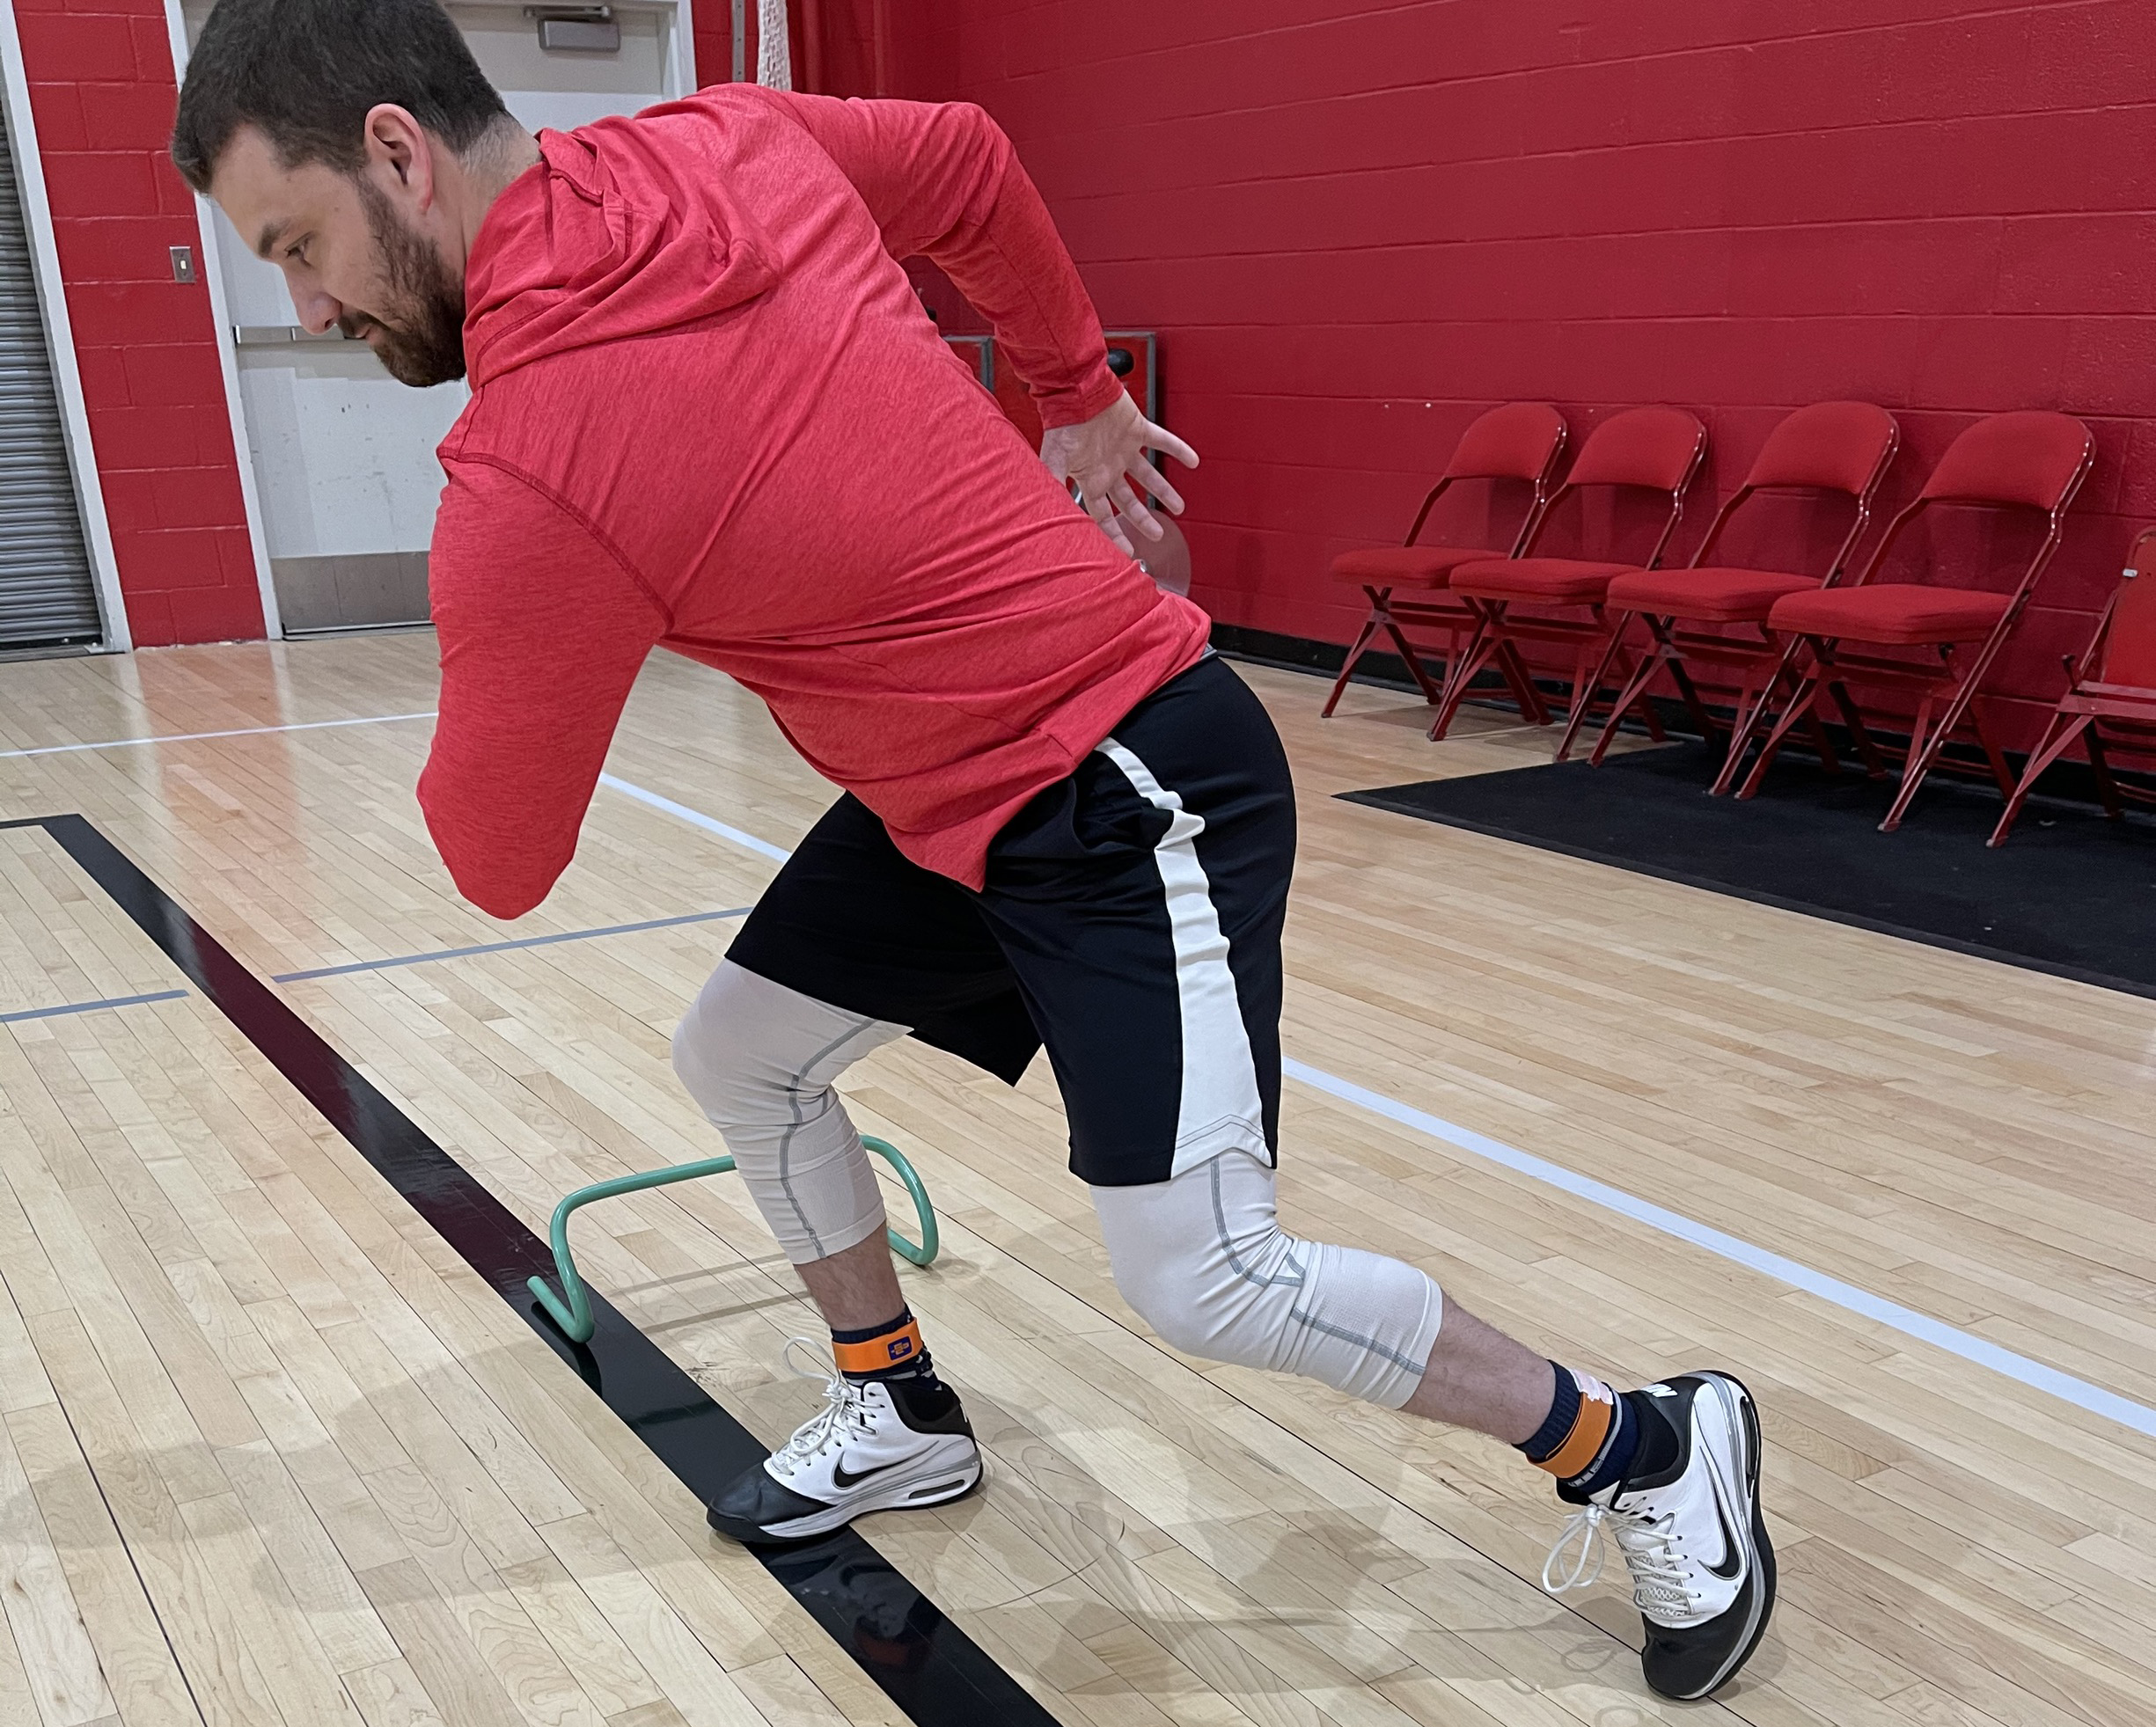
The load that athletes are exposed to in basketball takes place within a confined area and there is a big vertical component to what their limbs are experiencing. Simply looking at the distance covered doesn’t tell the whole story. With an IMU sensor on each ankle, they are able to get a much better understanding of what is occurring at the lower limbs.
“Coaches often intuitively know that certain drills are harder than others, which guides the periodization of the week leading up to games. But we didn’t have objective numbers to back that up. This question led us to really dig deep on which specific components of workload we care about.”
A proof of concept with IMU Step
During that proof of concept, Dr. Harry and his team identified and zoned in on Impact Load, Impact Asymmetry, and the distribution of those loads. These metrics helped answer two key questions that had been refined during this process:
- Does practice intensity match game intensity?
- Does the planned intensity meet the actual intensity?
“In the future, it may be interesting to dive into how load is affected when we play one team over another. Is intensity higher when we go to New York to play Duke vs playing a lower-level team down the street? These are the types of questions that we can now look to answer with IMU Step.”
As well as developing a wider relationship with the men’s basketball team, Dr.Harry and Jacob are now supporting the women’s program on their return-to-play processes and benchmarking protocols. These two areas were slightly different from the questions asked by the men’s team, but the insights from the sensors and the expertise of the human performance staff made this a natural next step.
“Is intensity higher when we go to New York to play Duke vs playing a lower-level team down the street? These are the types of questions that we can now look to answer with IMU Step.”
Benchmark testing with IMU Step
“Jacob has been spearheading the return to play concept with the women’s side”, Dr. Harry explains. “We have developed a battery of tests that is designed to last 30-40 minutes. There is a mixture of both unilateral and bilateral movements so we can get some more granular information on any asymmetries that are present. We have also tried our best to get these tests to be multiplanar due to the nature of basketball.”
“When developing this battery of tests,” Jacob explains. We consulted with John (Harry), Connor Agnew, the strength coach from the women’s team, and the athletic trainer. The six tests focusing on jumping, landing and running we chose were –
- Leap matrix
- Three cones are positioned in a line 1 meter apart from each other with a fourth cone 1 meter in front of the center cone; Athletes perform a unilateral leap from the center cone to each cone and back to the center cone before switching limbs; Athletes then walk to the front cone and perform a leap with rotation back to and from the corner cones alternating between limbs; Athletes complete three of each of the above-mentioned leaps, rest for 30 seconds and repeat the above.
- 5-10-5
- Three cones are positioned in a line 5 meters apart; Athletes begin at the center cone, sprint to one of the lateral cones, change directions, and sprint to the opposite cone before again changing directions and sprinting through the starting cone; Athletes walk back to the starting position and repeat the test in the opposite direction to complete a set with 30 seconds rest between sets.
- Three hurdle hop
- Hurdles are positioned at approximately mid-shin height and 1 meter apart; Athletes hop over each hurdle and return to the start position. This is repeated three times to complete a set. Athletes complete two sets total with 30 seconds rest between sets.
- Run-step-run-step-shuffle
- Athletes begin on one corner of the baseline of the court; They then shuffle along the baseline to the closer edge of the key; They then sprint along the baseline to the furthest edge of the key; Finally, the athletes again shuffle to the corner of the baseline; Following 30 seconds of rest the test is repeated in the opposite direction to complete a set; Athletes complete two total sets.
- Light reactive test
- Three lights are positioned in a line approximately five meters apart and two meters in front of the athlete; Upon illumination of one of the lights, athletes will sprint to that light and shuffle back to the starting location; Lights illuminate approximately 2 seconds after being contacted by the athlete; the test lasts 30 seconds; Athletes will rest for 1 minute and repeat for two total sets.
- Curved running
- Athletes start at one baseline location of the three-point line. Athletes will sprint along the three-point line to the opposite baseline location, pivot and sprint back to the starting position; Athletes will walk to the opposite baseline location and immediately repeat the test in the opposite direction to complete a set; Athletes will rest for 1 minute and repeat for two total sets.
“Some of the tests have been modified slightly in terms of the length of the test. For example, the athletes will perform the 5-10-5 a number of times with a walk back in between so that we collected enough data in the high-intensity bins to allow comparisons a lot easier.”
“Within these tests”, Jacob explains, “we are looking at Impact Load, asymmetry data, and how that load is distributed across low, medium, and high bins. This baseline testing will be introduced once NCAA regulation allows us the time to do so. Every athlete will hopefully come to us on day one fit and healthy which will allow us to get a reliable benchmark. Should any athlete then get injured, we have a gauge of where they need to return to.”
“We are aiming to complete this battery of tests two to three times per season.”
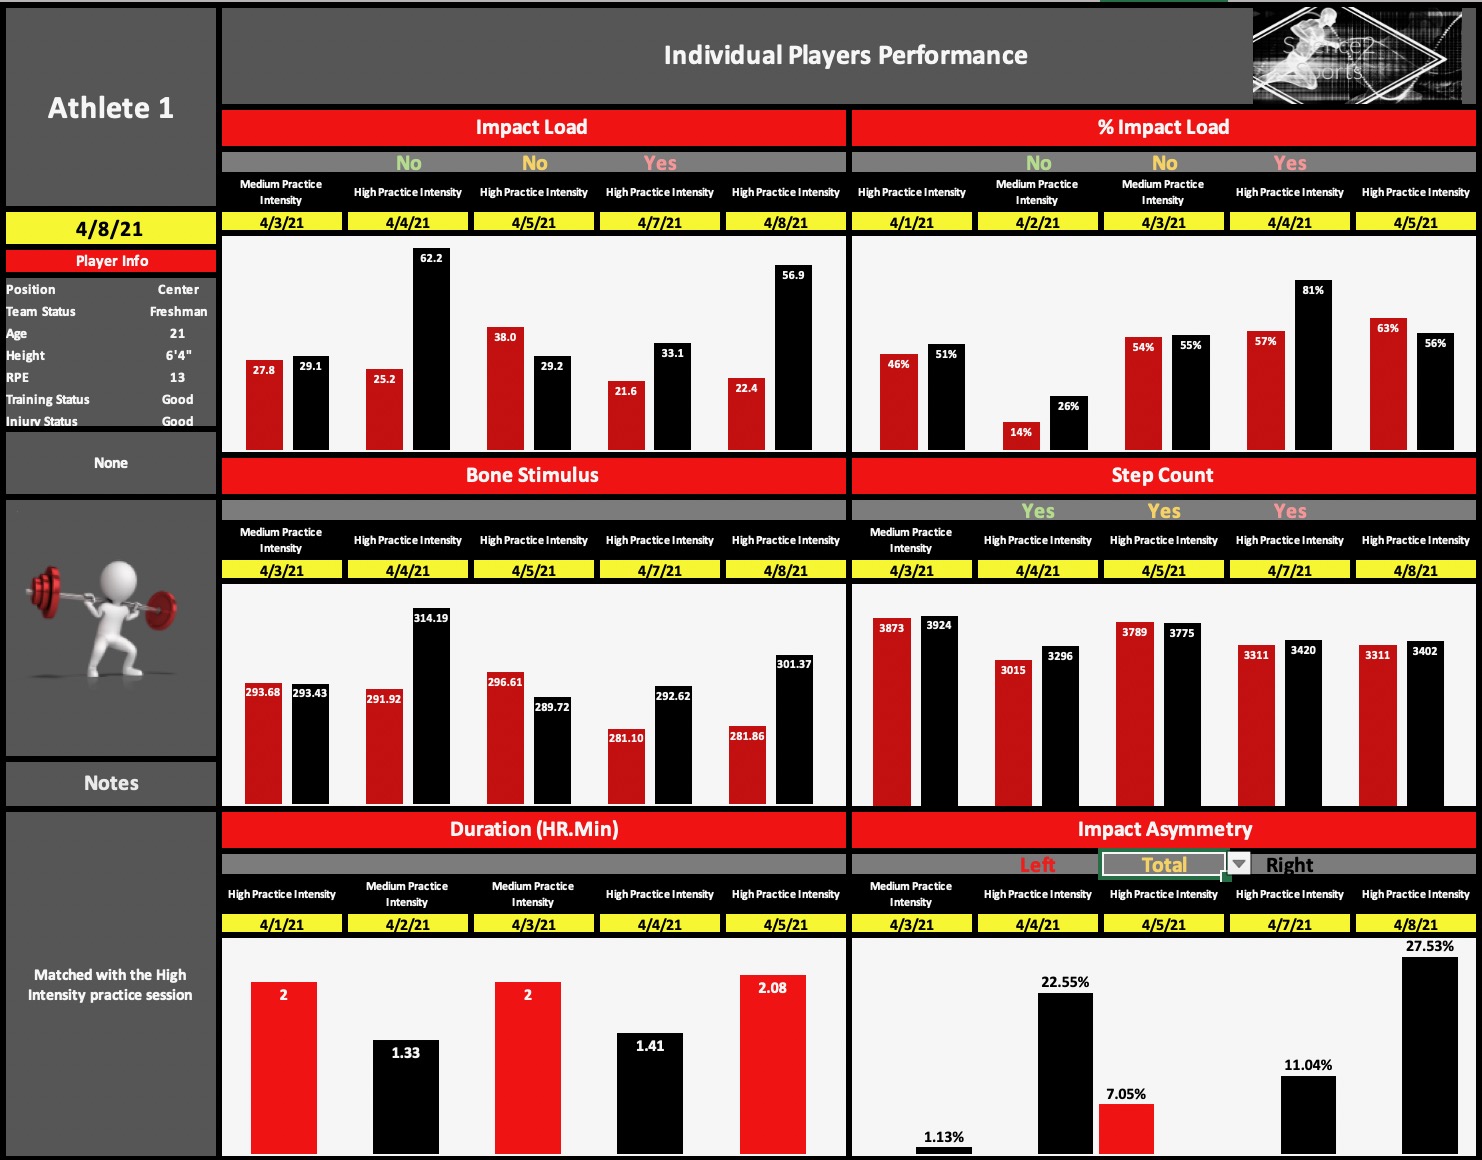
Figure 1: Individual player performance report
IMU Step data: beyond the dashboard
Jacob is also working on a project to visualize and communicate this data effectively to coaches. Jacob has worked as a strength and conditioning coach in the past and currently working as a sports scientist, he is able to make this information accessible and actionable for the technical and non-technical staff on both the men’s and women’s programs. Figure 1 shows how Jacob visualizes the data to help answer one of the team’s key questions: Does the actual intensity of practice match the coach’s planned intensity?
“As you can see here, we have exported all the IMU Step data and put it into our own Excel dashboard. We have created this dashboard to enable us to look at each intensity bin individually. In the black, you can see what the coach had planned the session to be. In this instance, red is the left limb and black is the right limb. The next phase for us on this is to build out our collection of RPE data so we can cross-reference the subjective data from the athlete against what the coach planned and the mechanical load from IMU Step.”
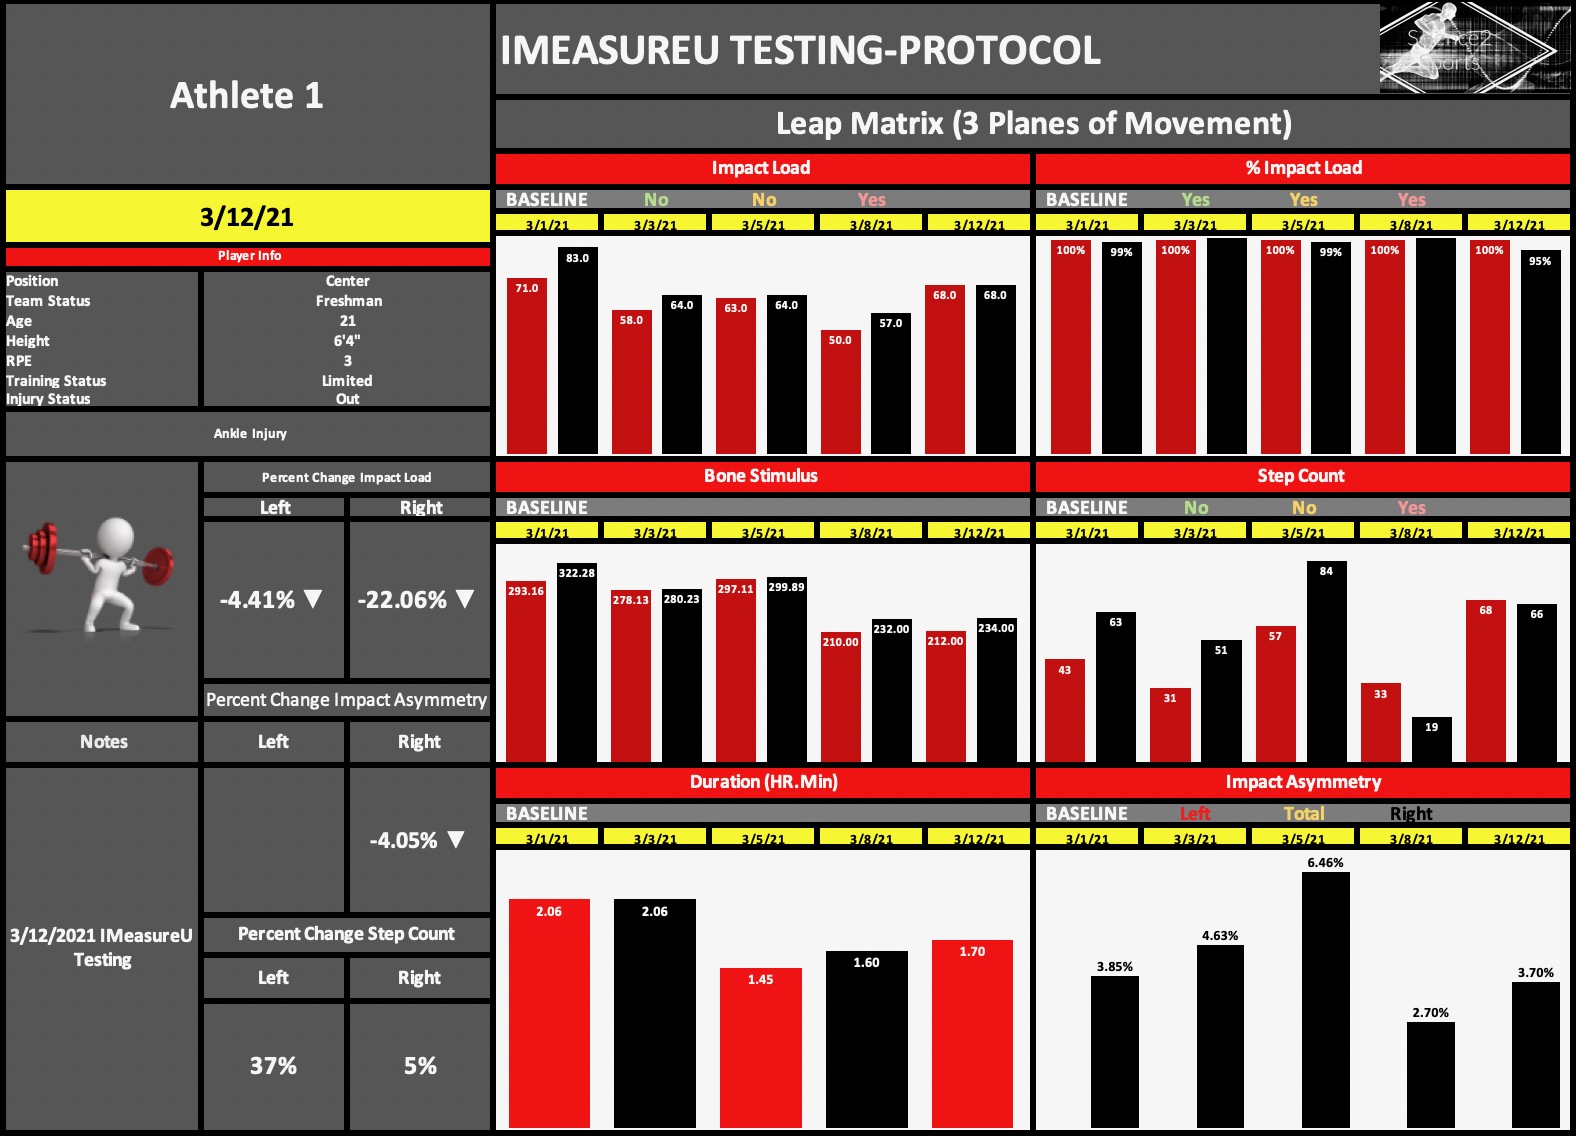
Figure 2: Return to play dashboard
“The return to play dashboard (figure 2) looks very similar but here we are looking at how testing differs compared to baseline. On the left we have a summary of percentage changes to how they compare to baseline.“
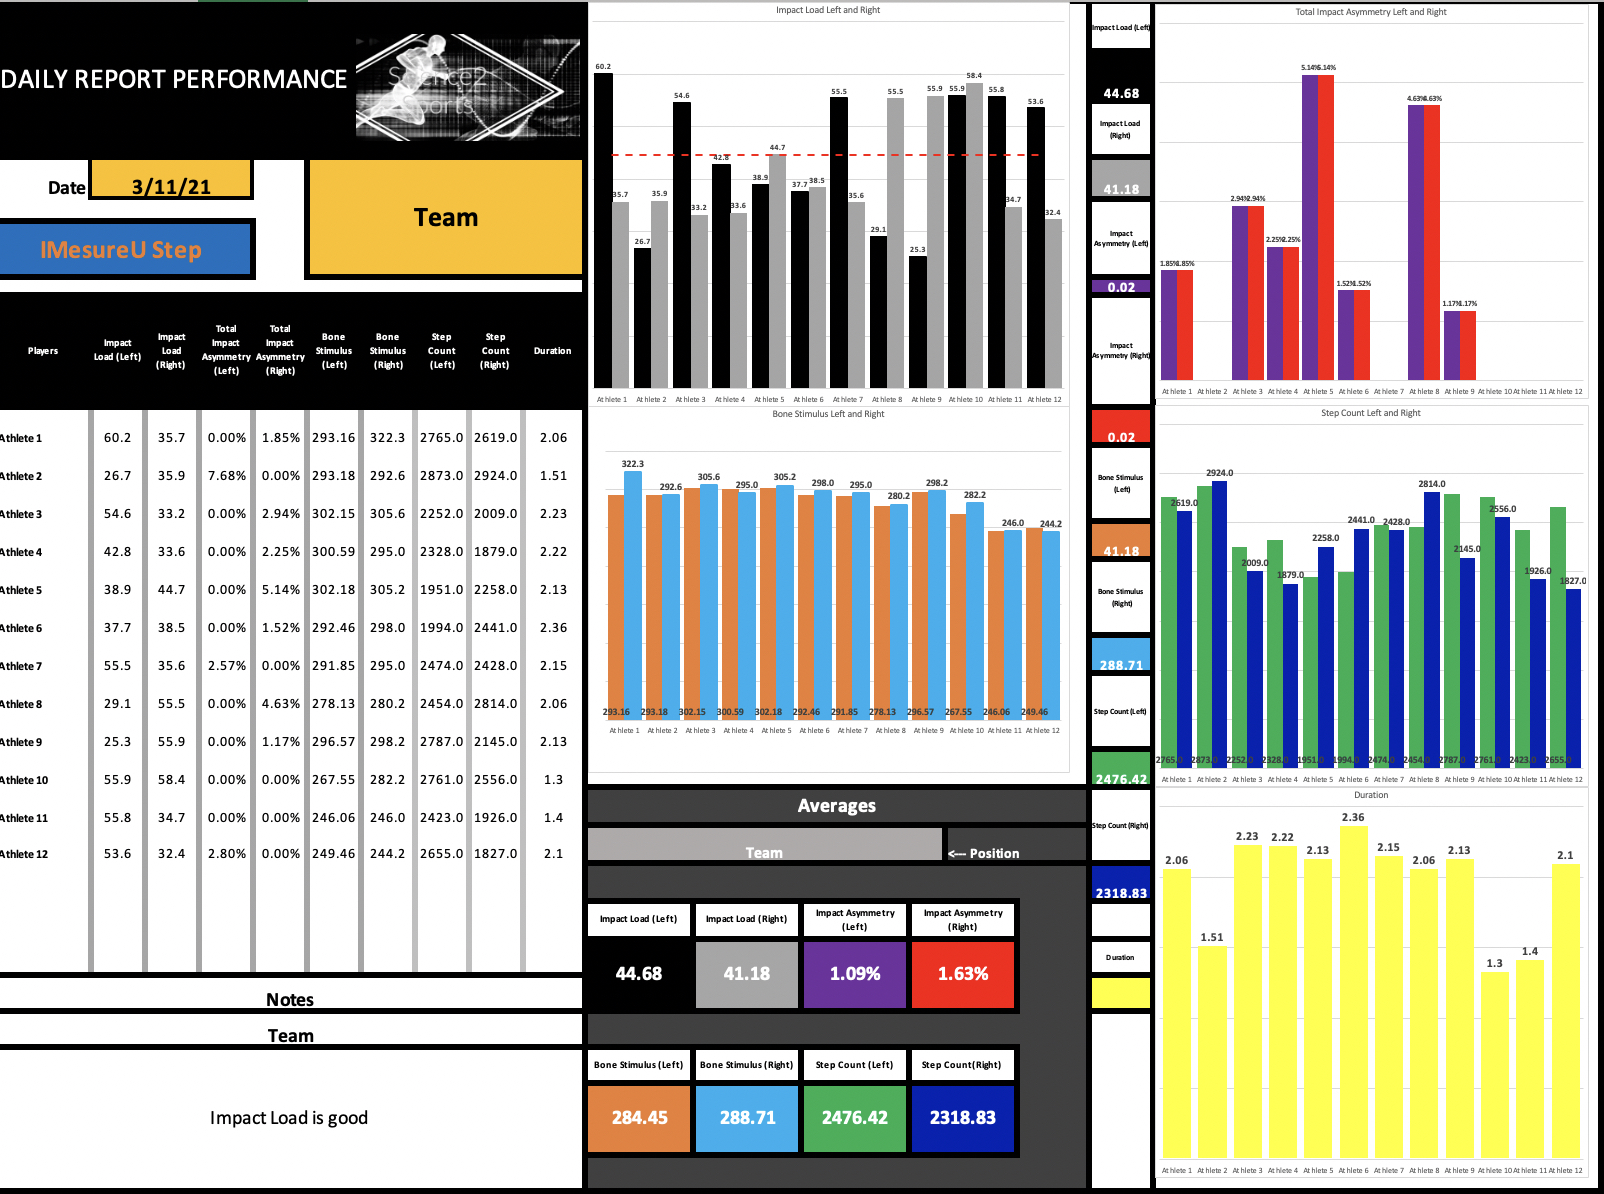
Figure 3: Daily dashboard
“On a day to day basis, we use this dashboard (figure 3) which allows us to filter by various player groups, individuals and by team. In this sheet we are also able to see daily percentage changes so we can make interventions should we see anything critical.”
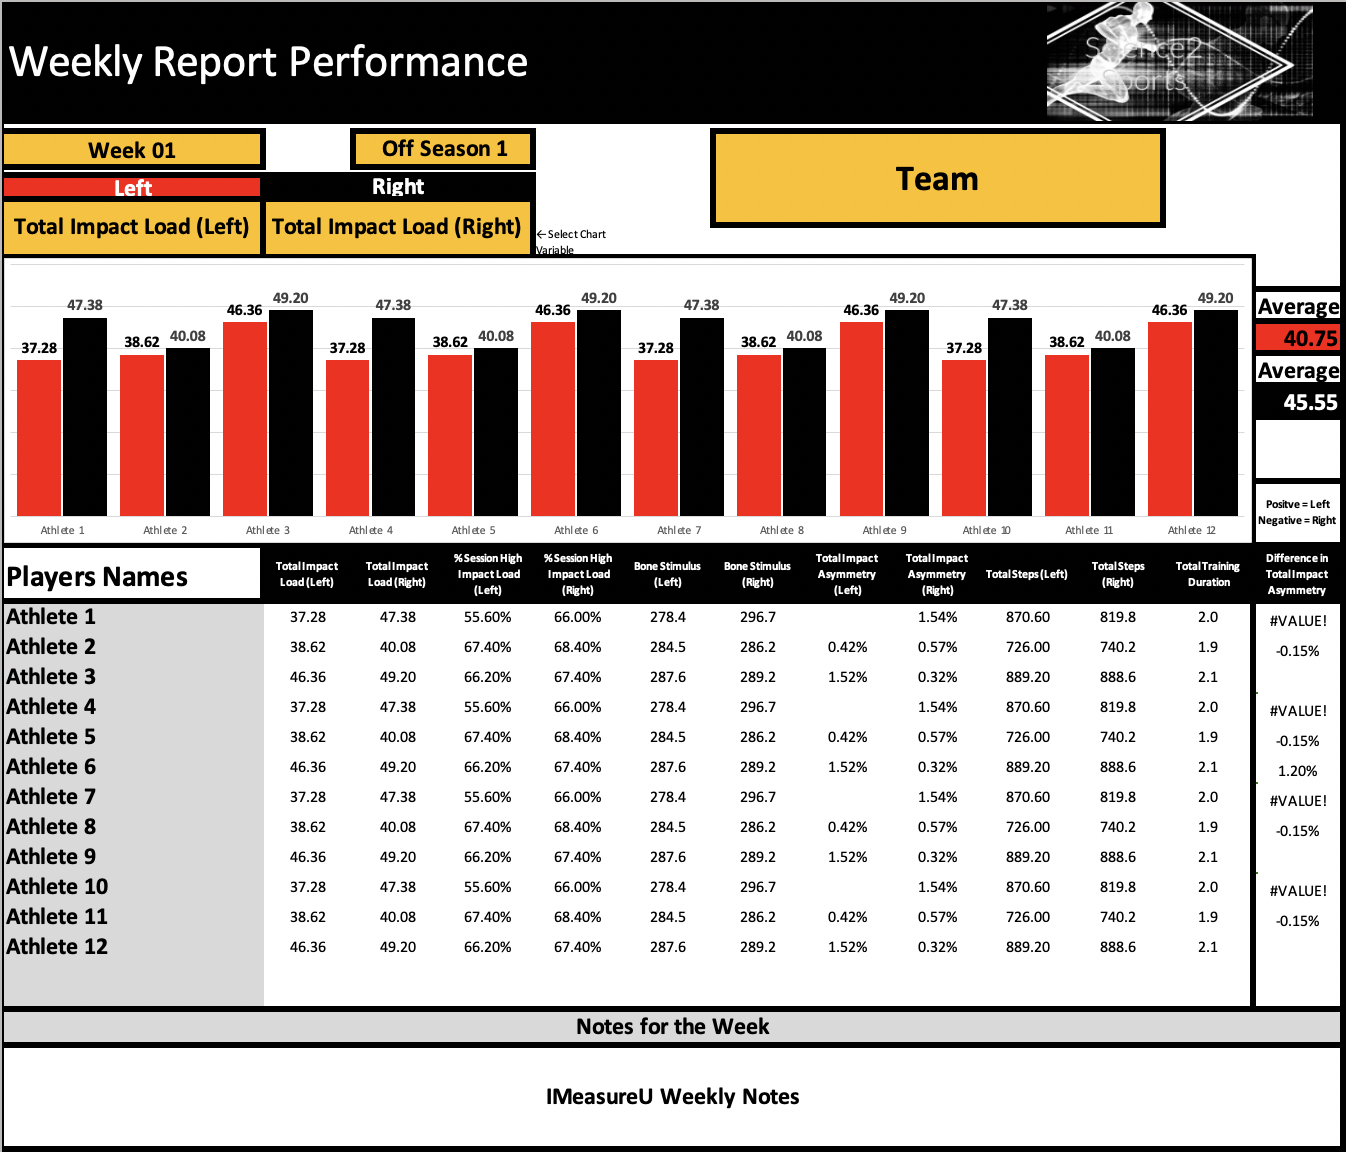
Figure 4: Weekly dashboard
“Then we have a weekly page (figure 4) so we can see how the week looks for an individual or playing group versus the averages over time.”
With the help of IMU-Step, Dr. Harry and Jacob are striving to answer the crucial questions asked by the technical and non-technical staff from the men’s and women’s basketball teams. A solid core of repeatable and consistent tests along with an eye for what metrics to focus on gives them a great foundation to improve the health and performance of the basketball teams. If you would like to speak with an applied scientist to learn more about how lower limb monitoring can help your team, click here to get in touch and schedule a meeting.
Learn more
This case study builds on concepts we’ve explored in-depth at IMeasureU. Follow the links below to learn more –
Practical Examples of Using IMU-Step to Modify Outcomes: Asymmetry and Impact Load in the Real World – a webinar with Andrew Gray
Understanding External Biomechanical Load During ACLR Rehabilitation – A webinar with Mark Armitage
Set Up for Success with Inertial Data – A Case Study with the Wests Tigers
Have an injured athlete? Get in touch with us and ask about a free demo of IMU Step to see how we can help your return to play.